29
/
en
AIzaSyAYiBZKx7MnpbEhh9jyipgxe19OcubqV5w
April 1, 2024
35066
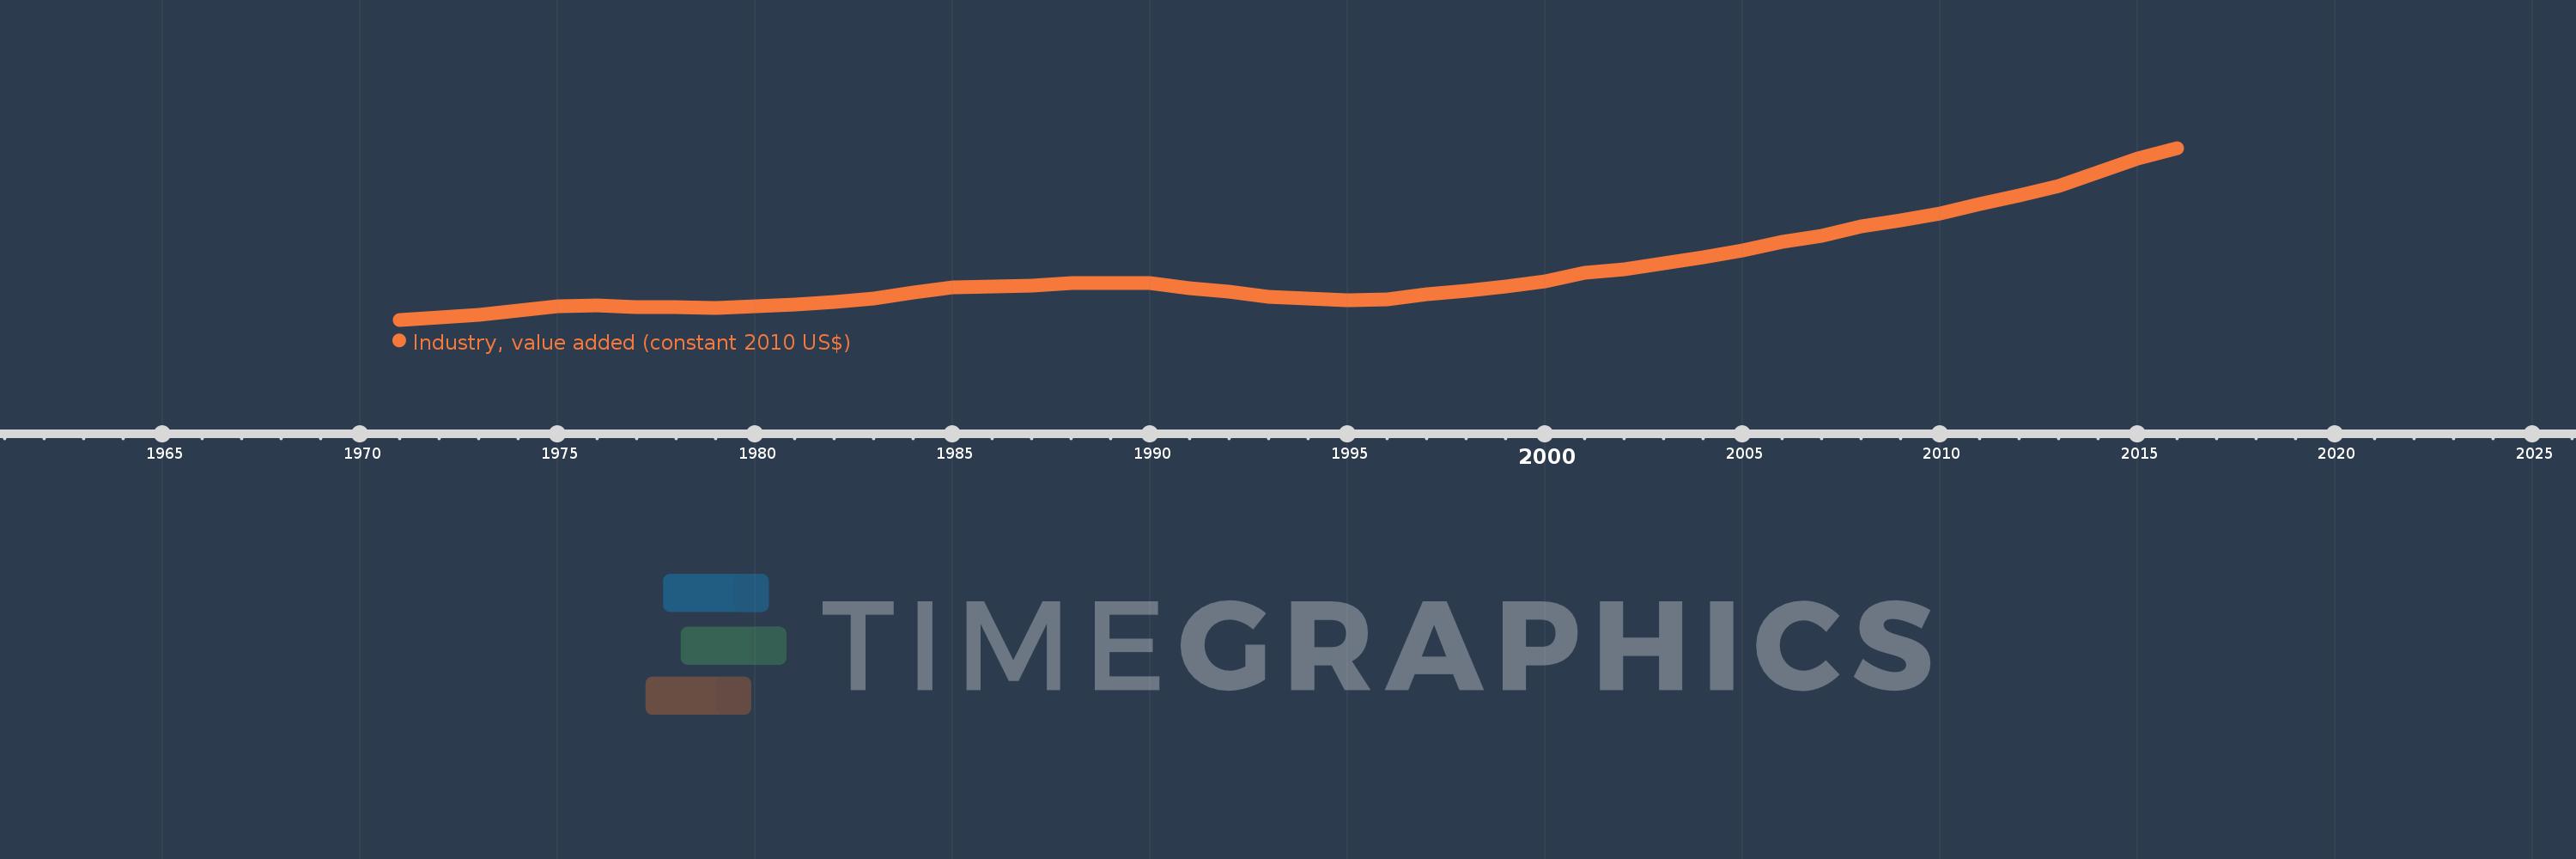
Heavily indebted poor countries (HIPC)
HPC
false
2
1
Industry, value added (constant 2010 US$)
2016,2015,2014,2013,2012,2011,2010,2009,2008,2007,2006,2005,2004,2003,2002,2001,2000,1999,1998,1997,1996,1995,1994,1993,1992,1991,1990,1989,1988,1987,1986,1985,1984,1983,1982,1981,1980,1979,1978,1977,1976,1975,1974,1973,1972,1971
This statistics in other country:
AfghanistanAlbaniaAlgeriaAndorraAntigua and BarbudaArab WorldArgentinaArmeniaArubaAustraliaAustriaAzerbaijanBahamas, TheBahrainBangladeshBarbadosBelarusBelgiumBelizeBeninBermudaBhutanBoliviaBosnia and HerzegovinaBotswanaBrazilBrunei DarussalamBulgariaBurkina FasoBurundiCabo VerdeCambodiaCameroonCanadaCaribbean small statesCentral African RepublicCentral Europe and the BalticsChadChileChinaColombiaComorosCongo, Dem. Rep.Congo, Rep.Costa RicaCote d'IvoireCroatiaCubaCyprusCzech RepublicDenmarkDominicaDominican RepublicEarly-demographic dividendEast Asia & PacificEast Asia & Pacific (excluding high income)East Asia & Pacific (IDA & IBRD countries)EcuadorEgypt, Arab Rep.El SalvadorEquatorial GuineaEstoniaEthiopiaEuro areaEurope & Central AsiaEurope & Central Asia (excluding high income)Europe & Central Asia (IDA & IBRD countries)European UnionFijiFinlandFragile and conflict affected situationsFranceGabonGambia, TheGeorgiaGermanyGhanaGreeceGrenadaGuatemalaGuineaGuinea-BissauGuyanaHeavily indebted poor countries (HIPC)High incomeHondurasHong Kong SAR, ChinaHungaryIBRD onlyIcelandIDA & IBRD totalIDA blendIDA onlyIDA totalIndiaIndonesiaIran, Islamic Rep.IraqIrelandItalyJamaicaJapanJordanKazakhstanKenyaKiribatiKorea, Rep.KosovoKuwaitKyrgyz RepublicLao PDRLate-demographic dividendLatin America & Caribbean Latin America & Caribbean (excluding high income)Latin America & the Caribbean (IDA & IBRD countries)LatviaLeast developed countries: UN classificationLebanonLesothoLiberiaLiechtensteinLithuaniaLow & middle incomeLow incomeLower middle incomeLuxembourgMacao SAR, ChinaMacedonia, FYRMadagascarMalawiMalaysiaMaldivesMaliMaltaMarshall IslandsMauritaniaMauritiusMexicoMicronesia, Fed. Sts.Middle East & North AfricaMiddle East & North Africa (excluding high income)Middle East & North Africa (IDA & IBRD countries)Middle incomeMoldovaMongoliaMontenegroMoroccoMozambiqueMyanmarNamibiaNepalNetherlandsNew ZealandNicaraguaNigerNigeriaNorth AmericaNorwayOECD membersOmanOther small statesPacific island small statesPakistanPalauPanamaParaguayPeruPhilippinesPolandPortugalPost-demographic dividendPre-demographic dividendPuerto RicoQatarRomaniaRussian FederationRwandaSamoaSao Tome and PrincipeSaudi ArabiaSenegalSerbiaSeychellesSierra LeoneSingaporeSlovak RepublicSloveniaSmall statesSouth AfricaSouth AsiaSouth Asia (IDA & IBRD)SpainSri LankaSt. Kitts and NevisSt. LuciaSt. Vincent and the GrenadinesSub-Saharan Africa Sub-Saharan Africa (excluding high income)Sub-Saharan Africa (IDA & IBRD countries)SudanSurinameSwazilandSwedenSwitzerlandTajikistanTanzaniaThailandTimor-LesteTogoTongaTrinidad and TobagoTunisiaTurkeyTurkmenistanTuvaluUgandaUkraineUnited Arab EmiratesUnited KingdomUnited StatesUpper middle incomeUruguayUzbekistanVanuatuVenezuela, RBVietnamWest Bank and GazaWorldYemen, Rep.ZambiaZimbabwe Timeline:
This timeline shows a graph from 1971 to 2016 of Heavily indebted poor countries (HIPC). No data until 1970. Number of actual observations by date: 46.
Source name:
World Development Indicators
Source organization:
World Bank national accounts data, and OECD National Accounts data files.
Categories, topics:
Economy & Growth
Last updated:
apr 23, 2017
Indicators value changes by year
Minimum:
36.947 bln
jan 1, 1971
Maximum:
145.763 bln
jan 1, 2016
At the date of observation
Value
Absolute change
Change from previous value
jan 1, 1971
36.947 bln
+36.947 bln
0.0%
jan 1, 1972
38.616 bln
+1.668 bln
4.52%
jan 1, 1973
39.787 bln
+1.171 bln
3.03%
jan 1, 1974
42.51 bln
+2.724 bln
6.85%
jan 1, 1975
45.699 bln
+3.189 bln
7.5%
jan 1, 1976
45.856 bln
+157.093 mln
0.34%
jan 1, 1977
45.199 bln
-657.17 mln
-1.43%
jan 1, 1978
45.128 bln
-70.396 mln
-0.16%
jan 1, 1979
44.346 bln
-782.707 mln
-1.73%
jan 1, 1980
45.217 bln
+871.562 mln
1.97%
jan 1, 1981
46.756 bln
+1.539 bln
3.4%
jan 1, 1982
48.356 bln
+1.6 bln
3.42%
jan 1, 1983
50.576 bln
+2.22 bln
4.59%
jan 1, 1984
53.94 bln
+3.364 bln
6.65%
jan 1, 1985
57.291 bln
+3.351 bln
6.21%
jan 1, 1986
58.147 bln
+856.468 mln
1.49%
jan 1, 1987
58.718 bln
+570.552 mln
0.98%
jan 1, 1988
60.309 bln
+1.591 bln
2.71%
jan 1, 1989
60.119 bln
-190.031 mln
-0.32%
jan 1, 1990
60.118 bln
-1.372 mln
0.0%
jan 1, 1991
56.979 bln
-3.139 bln
-5.22%
jan 1, 1992
54.472 bln
-2.507 bln
-4.4%
jan 1, 1993
51.329 bln
-3.143 bln
-5.77%
jan 1, 1994
50.536 bln
-792.578 mln
-1.54%
jan 1, 1995
49.379 bln
-1.157 bln
-2.29%
jan 1, 1996
50.03 bln
+651.498 mln
1.32%
jan 1, 1997
52.98 bln
+2.95 bln
5.9%
jan 1, 1998
55.309 bln
+2.33 bln
4.4%
jan 1, 1999
58.012 bln
+2.703 bln
4.89%
jan 1, 2000
61.23 bln
+3.218 bln
5.55%
jan 1, 2001
66.938 bln
+5.708 bln
9.32%
jan 1, 2002
69.156 bln
+2.219 bln
3.31%
jan 1, 2003
72.893 bln
+3.737 bln
5.4%
jan 1, 2004
76.534 bln
+3.641 bln
4.99%
jan 1, 2005
81.093 bln
+4.559 bln
5.96%
jan 1, 2006
86.477 bln
+5.384 bln
6.64%
jan 1, 2007
89.923 bln
+3.446 bln
3.98%
jan 1, 2008
95.989 bln
+6.066 bln
6.75%
jan 1, 2009
99.684 bln
+3.695 bln
3.85%
jan 1, 2010
104.25 bln
+4.566 bln
4.58%
jan 1, 2011
110.333 bln
+6.083 bln
5.83%
jan 1, 2012
115.863 bln
+5.53 bln
5.01%
jan 1, 2013
121.826 bln
+5.964 bln
5.15%
jan 1, 2014
130.528 bln
+8.701 bln
7.14%
jan 1, 2015
139.032 bln
+8.504 bln
6.52%
jan 1, 2016
145.763 bln
+6.731 bln
4.84%
Ranking of countries by current statistics by years


Comments: