29
/
en
AIzaSyAYiBZKx7MnpbEhh9jyipgxe19OcubqV5w
April 1, 2024
100071
Cameroon
CMR
true
2
1
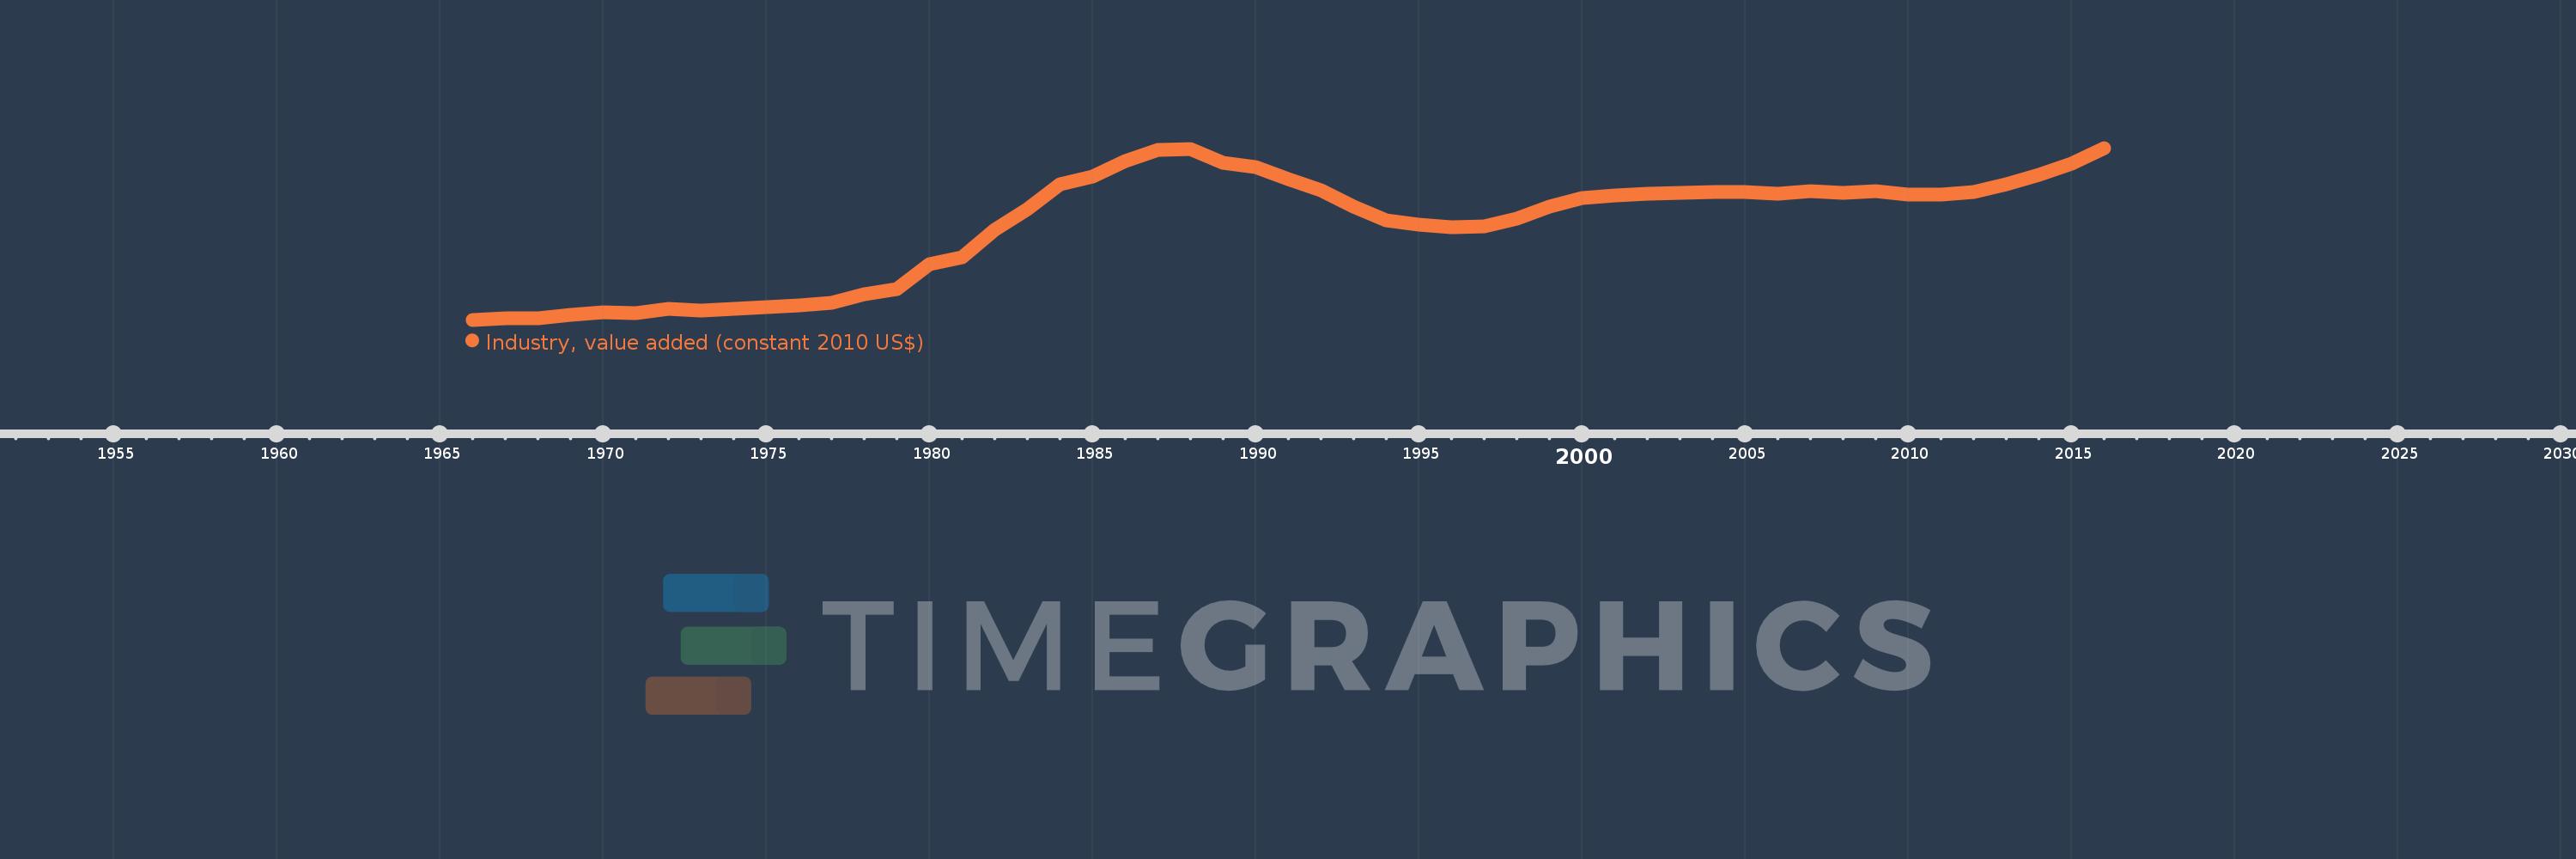
Industry, value added (constant 2010 US$)
2016,2015,2014,2013,2012,2011,2010,2009,2008,2007,2006,2005,2004,2003,2002,2001,2000,1999,1998,1997,1996,1995,1994,1993,1992,1991,1990,1989,1988,1987,1986,1985,1984,1983,1982,1981,1980,1979,1978,1977,1976,1975,1974,1973,1972,1971,1970,1969,1968,1967,1966
This statistics in other country:
AfghanistanAlbaniaAlgeriaAndorraAntigua and BarbudaArab WorldArgentinaArmeniaArubaAustraliaAustriaAzerbaijanBahamas, TheBahrainBangladeshBarbadosBelarusBelgiumBelizeBeninBermudaBhutanBoliviaBosnia and HerzegovinaBotswanaBrazilBrunei DarussalamBulgariaBurkina FasoBurundiCabo VerdeCambodiaCameroonCanadaCaribbean small statesCentral African RepublicCentral Europe and the BalticsChadChileChinaColombiaComorosCongo, Dem. Rep.Congo, Rep.Costa RicaCote d'IvoireCroatiaCubaCyprusCzech RepublicDenmarkDominicaDominican RepublicEarly-demographic dividendEast Asia & PacificEast Asia & Pacific (excluding high income)East Asia & Pacific (IDA & IBRD countries)EcuadorEgypt, Arab Rep.El SalvadorEquatorial GuineaEstoniaEthiopiaEuro areaEurope & Central AsiaEurope & Central Asia (excluding high income)Europe & Central Asia (IDA & IBRD countries)European UnionFijiFinlandFragile and conflict affected situationsFranceGabonGambia, TheGeorgiaGermanyGhanaGreeceGrenadaGuatemalaGuineaGuinea-BissauGuyanaHeavily indebted poor countries (HIPC)High incomeHondurasHong Kong SAR, ChinaHungaryIBRD onlyIcelandIDA & IBRD totalIDA blendIDA onlyIDA totalIndiaIndonesiaIran, Islamic Rep.IraqIrelandItalyJamaicaJapanJordanKazakhstanKenyaKiribatiKorea, Rep.KosovoKuwaitKyrgyz RepublicLao PDRLate-demographic dividendLatin America & Caribbean Latin America & Caribbean (excluding high income)Latin America & the Caribbean (IDA & IBRD countries)LatviaLeast developed countries: UN classificationLebanonLesothoLiberiaLiechtensteinLithuaniaLow & middle incomeLow incomeLower middle incomeLuxembourgMacao SAR, ChinaMacedonia, FYRMadagascarMalawiMalaysiaMaldivesMaliMaltaMarshall IslandsMauritaniaMauritiusMexicoMicronesia, Fed. Sts.Middle East & North AfricaMiddle East & North Africa (excluding high income)Middle East & North Africa (IDA & IBRD countries)Middle incomeMoldovaMongoliaMontenegroMoroccoMozambiqueMyanmarNamibiaNepalNetherlandsNew ZealandNicaraguaNigerNigeriaNorth AmericaNorwayOECD membersOmanOther small statesPacific island small statesPakistanPalauPanamaParaguayPeruPhilippinesPolandPortugalPost-demographic dividendPre-demographic dividendPuerto RicoQatarRomaniaRussian FederationRwandaSamoaSao Tome and PrincipeSaudi ArabiaSenegalSerbiaSeychellesSierra LeoneSingaporeSlovak RepublicSloveniaSmall statesSouth AfricaSouth AsiaSouth Asia (IDA & IBRD)SpainSri LankaSt. Kitts and NevisSt. LuciaSt. Vincent and the GrenadinesSub-Saharan Africa Sub-Saharan Africa (excluding high income)Sub-Saharan Africa (IDA & IBRD countries)SudanSurinameSwazilandSwedenSwitzerlandTajikistanTanzaniaThailandTimor-LesteTogoTongaTrinidad and TobagoTunisiaTurkeyTurkmenistanTuvaluUgandaUkraineUnited Arab EmiratesUnited KingdomUnited StatesUpper middle incomeUruguayUzbekistanVanuatuVenezuela, RBVietnamWest Bank and GazaWorldYemen, Rep.ZambiaZimbabwe Timeline:
This timeline shows a graph from 1966 to 2016 of Cameroon. No data until 1965. Number of actual observations by date: 51.
Source name:
World Development Indicators
Source organization:
World Bank national accounts data, and OECD National Accounts data files.
Categories, topics:
Economy & Growth
Last updated:
apr 23, 2017
Indicators value changes by year
Minimum:
1.123 bln
jan 1, 1966
Maximum:
8.542 bln
jan 1, 2016
At the date of observation
Value
Absolute change
Change from previous value
jan 1, 1966
1.123 bln
+1.123 bln
0.0%
jan 1, 1967
1.183 bln
+59.183 mln
5.27%
jan 1, 1968
1.198 bln
+15.362 mln
1.3%
jan 1, 1969
1.342 bln
+144.236 mln
12.04%
jan 1, 1970
1.43 bln
+87.7 mln
6.53%
jan 1, 1971
1.411 bln
-18.633 mln
-1.3%
jan 1, 1972
1.581 bln
+170.151 mln
12.06%
jan 1, 1973
1.527 bln
-54.189 mln
-3.43%
jan 1, 1974
1.591 bln
+63.876 mln
4.18%
jan 1, 1975
1.677 bln
+86.243 mln
5.42%
jan 1, 1976
1.739 bln
+61.264 mln
3.65%
jan 1, 1977
1.872 bln
+133.463 mln
7.68%
jan 1, 1978
2.215 bln
+343.274 mln
18.34%
jan 1, 1979
2.447 bln
+231.323 mln
10.44%
jan 1, 1980
3.515 bln
+1.068 bln
43.66%
jan 1, 1981
3.826 bln
+311.289 mln
8.86%
jan 1, 1982
5.0 bln
+1.174 bln
30.68%
jan 1, 1983
5.899 bln
+899.535 mln
17.99%
jan 1, 1984
6.982 bln
+1.082 bln
18.34%
jan 1, 1985
7.325 bln
+343.541 mln
4.92%
jan 1, 1986
7.958 bln
+632.862 mln
8.64%
jan 1, 1987
8.443 bln
+484.797 mln
6.09%
jan 1, 1988
8.486 bln
+43.434 mln
0.51%
jan 1, 1989
7.885 bln
-601.349 mln
-7.09%
jan 1, 1990
7.703 bln
-181.442 mln
-2.3%
jan 1, 1991
7.18 bln
-523.837 mln
-6.8%
jan 1, 1992
6.706 bln
-473.856 mln
-6.6%
jan 1, 1993
6.008 bln
-697.402 mln
-10.4%
jan 1, 1994
5.411 bln
-597.308 mln
-9.94%
jan 1, 1995
5.237 bln
-173.852 mln
-3.21%
jan 1, 1996
5.115 bln
-121.919 mln
-2.33%
jan 1, 1997
5.159 bln
+43.312 mln
0.85%
jan 1, 1998
5.491 bln
+332.224 mln
6.44%
jan 1, 1999
6.006 bln
+514.702 mln
9.37%
jan 1, 2000
6.364 bln
+358.13 mln
5.96%
jan 1, 2001
6.494 bln
+130.683 mln
2.05%
jan 1, 2002
6.56 bln
+65.788 mln
1.01%
jan 1, 2003
6.611 bln
+50.711 mln
0.77%
jan 1, 2004
6.647 bln
+36.023 mln
0.54%
jan 1, 2005
6.632 bln
-14.682 mln
-0.22%
jan 1, 2006
6.572 bln
-60.524 mln
-0.91%
jan 1, 2007
6.691 bln
+118.995 mln
1.81%
jan 1, 2008
6.597 bln
-93.357 mln
-1.4%
jan 1, 2009
6.678 bln
+80.26 mln
1.22%
jan 1, 2010
6.512 bln
-165.866 mln
-2.48%
jan 1, 2011
6.545 bln
+33.449 mln
0.51%
jan 1, 2012
6.647 bln
+101.982 mln
1.56%
jan 1, 2013
6.971 bln
+323.5 mln
4.87%
jan 1, 2014
7.366 bln
+395.145 mln
5.67%
jan 1, 2015
7.866 bln
+500.49 mln
6.79%
jan 1, 2016
8.542 bln
+675.819 mln
8.59%
Ranking of countries by current statistics by years


Comments: