29
/
en
AIzaSyAYiBZKx7MnpbEhh9jyipgxe19OcubqV5w
April 1, 2024
193170
Mauritania
MRT
true
2
1
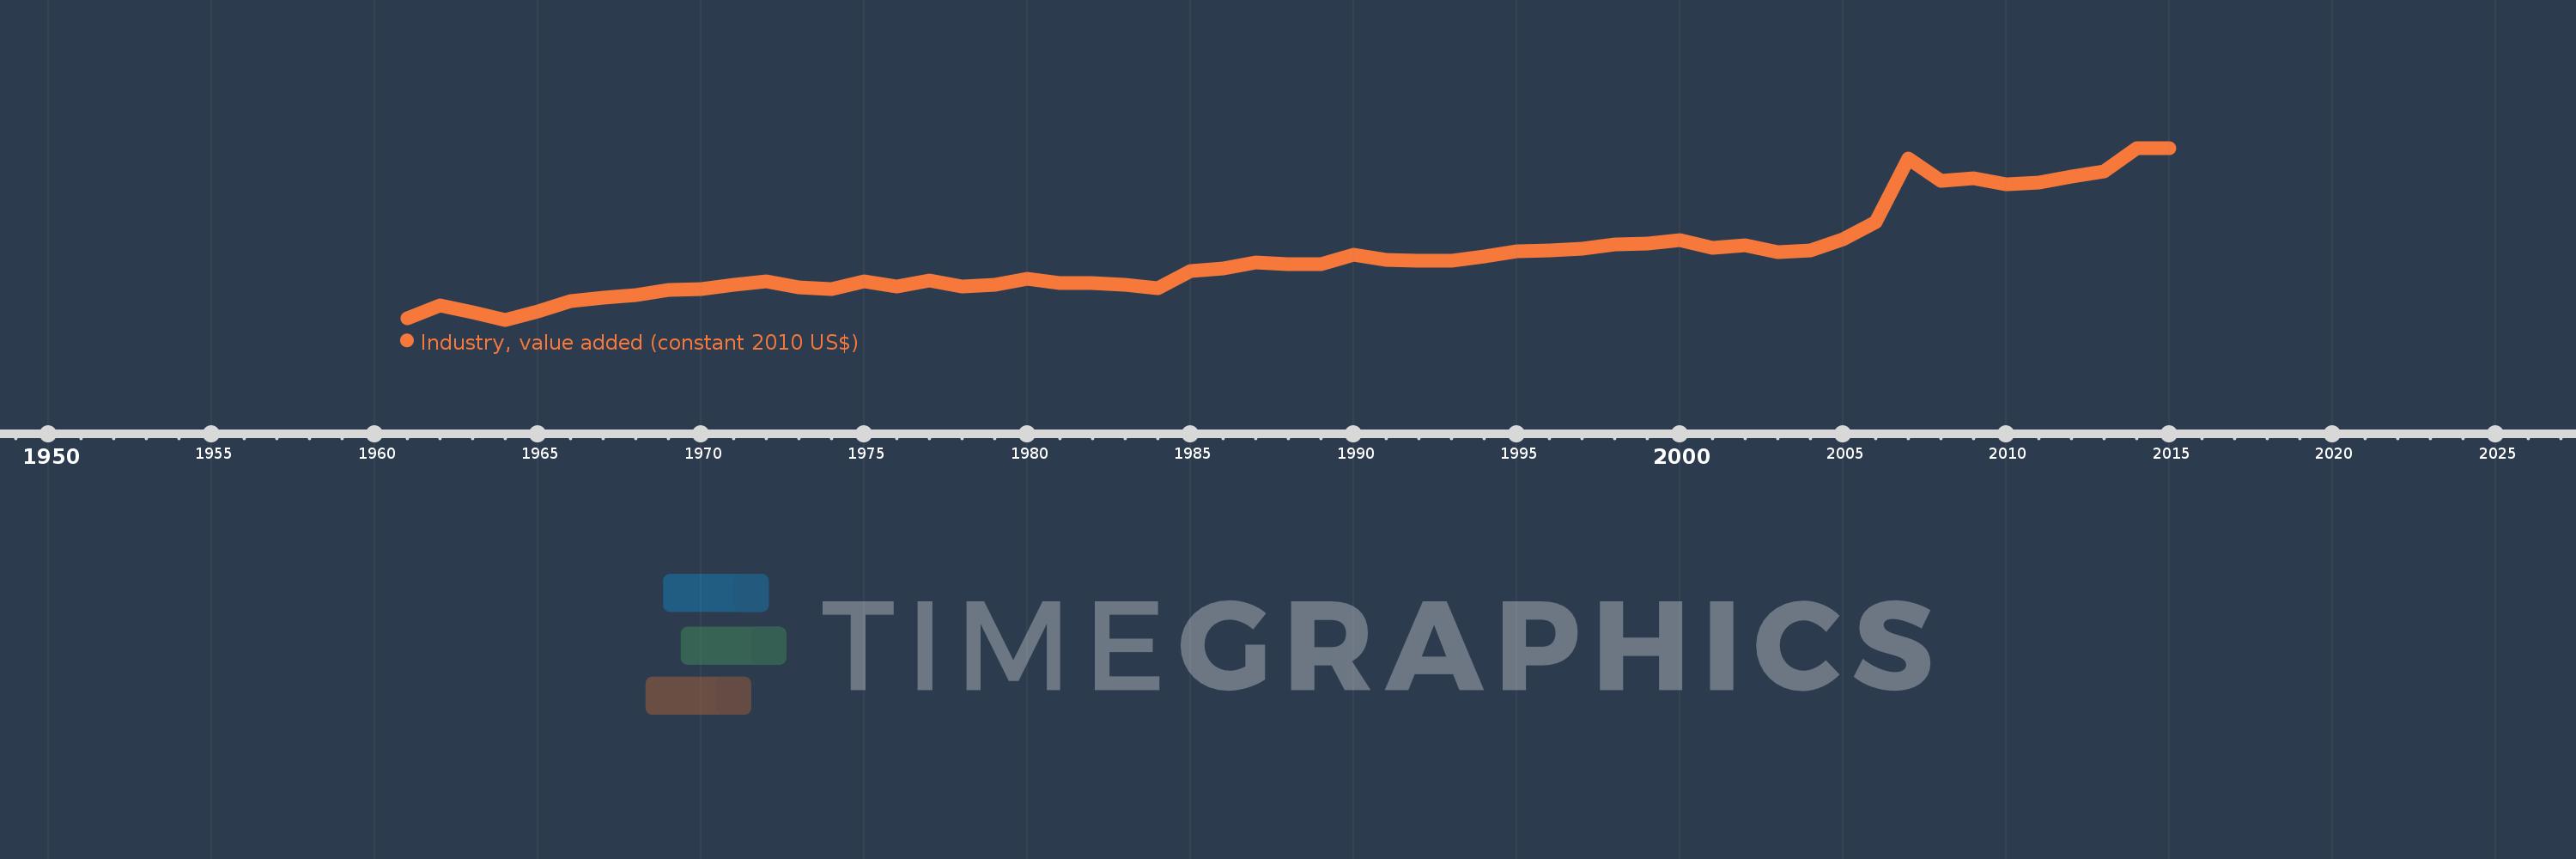
Industry, value added (constant 2010 US$)
2015,2014,2013,2012,2011,2010,2009,2008,2007,2006,2005,2004,2003,2002,2001,2000,1999,1998,1997,1996,1995,1994,1993,1992,1991,1990,1989,1988,1987,1986,1985,1984,1983,1982,1981,1980,1979,1978,1977,1976,1975,1974,1973,1972,1971,1970,1969,1968,1967,1966,1965,1964,1963,1962,1961
This statistics in other country:
AfghanistanAlbaniaAlgeriaAndorraAntigua and BarbudaArab WorldArgentinaArmeniaArubaAustraliaAustriaAzerbaijanBahamas, TheBahrainBangladeshBarbadosBelarusBelgiumBelizeBeninBermudaBhutanBoliviaBosnia and HerzegovinaBotswanaBrazilBrunei DarussalamBulgariaBurkina FasoBurundiCabo VerdeCambodiaCameroonCanadaCaribbean small statesCentral African RepublicCentral Europe and the BalticsChadChileChinaColombiaComorosCongo, Dem. Rep.Congo, Rep.Costa RicaCote d'IvoireCroatiaCubaCyprusCzech RepublicDenmarkDominicaDominican RepublicEarly-demographic dividendEast Asia & PacificEast Asia & Pacific (excluding high income)East Asia & Pacific (IDA & IBRD countries)EcuadorEgypt, Arab Rep.El SalvadorEquatorial GuineaEstoniaEthiopiaEuro areaEurope & Central AsiaEurope & Central Asia (excluding high income)Europe & Central Asia (IDA & IBRD countries)European UnionFijiFinlandFragile and conflict affected situationsFranceGabonGambia, TheGeorgiaGermanyGhanaGreeceGrenadaGuatemalaGuineaGuinea-BissauGuyanaHeavily indebted poor countries (HIPC)High incomeHondurasHong Kong SAR, ChinaHungaryIBRD onlyIcelandIDA & IBRD totalIDA blendIDA onlyIDA totalIndiaIndonesiaIran, Islamic Rep.IraqIrelandItalyJamaicaJapanJordanKazakhstanKenyaKiribatiKorea, Rep.KosovoKuwaitKyrgyz RepublicLao PDRLate-demographic dividendLatin America & Caribbean Latin America & Caribbean (excluding high income)Latin America & the Caribbean (IDA & IBRD countries)LatviaLeast developed countries: UN classificationLebanonLesothoLiberiaLiechtensteinLithuaniaLow & middle incomeLow incomeLower middle incomeLuxembourgMacao SAR, ChinaMacedonia, FYRMadagascarMalawiMalaysiaMaldivesMaliMaltaMarshall IslandsMauritaniaMauritiusMexicoMicronesia, Fed. Sts.Middle East & North AfricaMiddle East & North Africa (excluding high income)Middle East & North Africa (IDA & IBRD countries)Middle incomeMoldovaMongoliaMontenegroMoroccoMozambiqueMyanmarNamibiaNepalNetherlandsNew ZealandNicaraguaNigerNigeriaNorth AmericaNorwayOECD membersOmanOther small statesPacific island small statesPakistanPalauPanamaParaguayPeruPhilippinesPolandPortugalPost-demographic dividendPre-demographic dividendPuerto RicoQatarRomaniaRussian FederationRwandaSamoaSao Tome and PrincipeSaudi ArabiaSenegalSerbiaSeychellesSierra LeoneSingaporeSlovak RepublicSloveniaSmall statesSouth AfricaSouth AsiaSouth Asia (IDA & IBRD)SpainSri LankaSt. Kitts and NevisSt. LuciaSt. Vincent and the GrenadinesSub-Saharan Africa Sub-Saharan Africa (excluding high income)Sub-Saharan Africa (IDA & IBRD countries)SudanSurinameSwazilandSwedenSwitzerlandTajikistanTanzaniaThailandTimor-LesteTogoTongaTrinidad and TobagoTunisiaTurkeyTurkmenistanTuvaluUgandaUkraineUnited Arab EmiratesUnited KingdomUnited StatesUpper middle incomeUruguayUzbekistanVanuatuVenezuela, RBVietnamWest Bank and GazaWorldYemen, Rep.ZambiaZimbabwe Timeline:
This timeline shows a graph from 1961 to 2015 of Mauritania. No data until 1960. Number of actual observations by date: 55.
Source name:
World Development Indicators
Source organization:
World Bank national accounts data, and OECD National Accounts data files.
Categories, topics:
Economy & Growth
Last updated:
apr 23, 2017
Indicators value changes by year
Minimum:
203.098 mln
jan 1, 1964
Maximum:
2.063 bln
jan 1, 2015
At the date of observation
Value
Absolute change
Change from previous value
jan 1, 1961
216.475 mln
+216.475 mln
0.0%
jan 1, 1962
360.588 mln
+144.113 mln
66.57%
jan 1, 1963
283.919 mln
-76.668 mln
-21.26%
jan 1, 1964
203.098 mln
-80.821 mln
-28.47%
jan 1, 1965
292.43 mln
+89.333 mln
43.98%
jan 1, 1966
401.738 mln
+109.307 mln
37.38%
jan 1, 1967
438.42 mln
+36.683 mln
9.13%
jan 1, 1968
467.083 mln
+28.662 mln
6.54%
jan 1, 1969
526.162 mln
+59.079 mln
12.65%
jan 1, 1970
531.512 mln
+5.35 mln
1.02%
jan 1, 1971
582.56 mln
+51.049 mln
9.6%
jan 1, 1972
616.677 mln
+34.116 mln
5.86%
jan 1, 1973
556.085 mln
-60.591 mln
-9.83%
jan 1, 1974
538.606 mln
-17.479 mln
-3.14%
jan 1, 1975
621.386 mln
+82.78 mln
15.37%
jan 1, 1976
561.376 mln
-60.01 mln
-9.66%
jan 1, 1977
627.426 mln
+66.05 mln
11.77%
jan 1, 1978
558.918 mln
-68.508 mln
-10.92%
jan 1, 1979
582.876 mln
+23.958 mln
4.29%
jan 1, 1980
644.856 mln
+61.98 mln
10.63%
jan 1, 1981
602.902 mln
-41.954 mln
-6.51%
jan 1, 1982
602.621 mln
-280.791K
-0.05%
jan 1, 1983
578.171 mln
-24.45 mln
-4.06%
jan 1, 1984
544.72 mln
-33.451 mln
-5.79%
jan 1, 1985
727.843 mln
+183.123 mln
33.62%
jan 1, 1986
757.846 mln
+30.003 mln
4.12%
jan 1, 1987
823.861 mln
+66.015 mln
8.71%
jan 1, 1988
801.495 mln
-22.366 mln
-2.71%
jan 1, 1989
808.786 mln
+7.291 mln
0.91%
jan 1, 1990
908.745 mln
+99.959 mln
12.36%
jan 1, 1991
847.903 mln
-60.842 mln
-6.7%
jan 1, 1992
843.419 mln
-4.483 mln
-0.53%
jan 1, 1993
838.96 mln
-4.459 mln
-0.53%
jan 1, 1994
892.232 mln
+53.272 mln
6.35%
jan 1, 1995
941.285 mln
+49.052 mln
5.5%
jan 1, 1996
951.826 mln
+10.541 mln
1.12%
jan 1, 1997
972.866 mln
+21.04 mln
2.21%
jan 1, 1998
1.022 bln
+48.708 mln
5.01%
jan 1, 1999
1.029 bln
+7.129 mln
0.7%
jan 1, 2000
1.069 bln
+39.815 mln
3.87%
jan 1, 2001
984.776 mln
-83.741 mln
-7.84%
jan 1, 2002
1.005 bln
+20.274 mln
2.06%
jan 1, 2003
933.839 mln
-71.212 mln
-7.09%
jan 1, 2004
953.715 mln
+19.876 mln
2.13%
jan 1, 2005
1.077 bln
+123.747 mln
12.98%
jan 1, 2006
1.256 bln
+178.377 mln
16.56%
jan 1, 2007
1.946 bln
+689.875 mln
54.93%
jan 1, 2008
1.71 bln
-235.702 mln
-12.11%
jan 1, 2009
1.733 bln
+23.038 mln
1.35%
jan 1, 2010
1.666 bln
-67.091 mln
-3.87%
jan 1, 2011
1.692 bln
+26.349 mln
1.58%
jan 1, 2012
1.755 bln
+62.563 mln
3.7%
jan 1, 2013
1.808 bln
+53.466 mln
3.05%
jan 1, 2014
2.061 bln
+252.41 mln
13.96%
jan 1, 2015
2.063 bln
+1.979 mln
0.1%
Ranking of countries by current statistics by years


Comments: