29
/
en
AIzaSyAYiBZKx7MnpbEhh9jyipgxe19OcubqV5w
April 1, 2024
85870
Bhutan
BTN
true
2
1
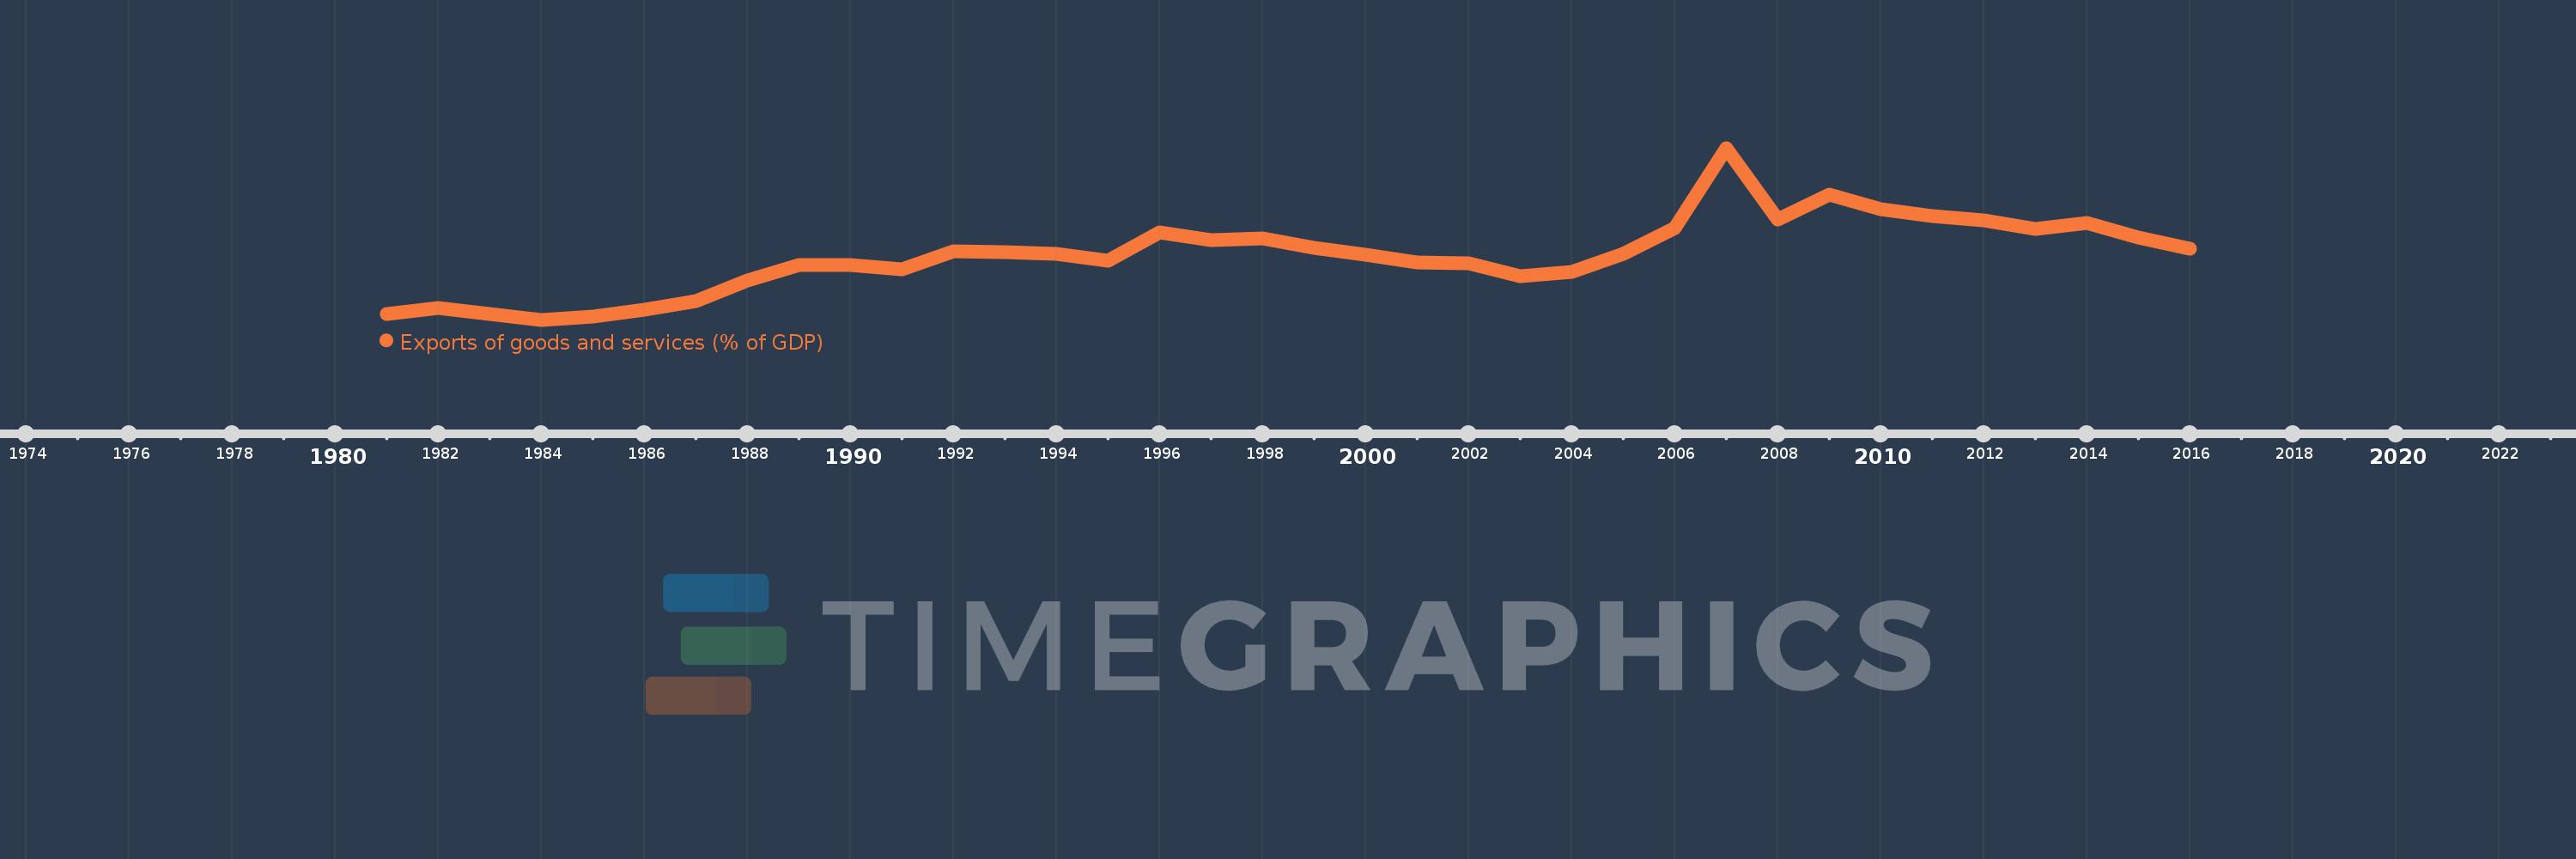
Exports of goods and services (% of GDP)
2016,2015,2014,2013,2012,2011,2010,2009,2008,2007,2006,2005,2004,2003,2002,2001,2000,1999,1998,1997,1996,1995,1994,1993,1992,1991,1990,1989,1988,1987,1986,1985,1984,1983,1982,1981
This statistics in other country:
AfghanistanAlbaniaAlgeriaAngolaAntigua and BarbudaArab WorldArgentinaArmeniaArubaAustraliaAustriaAzerbaijanBahamas, TheBahrainBangladeshBarbadosBelarusBelgiumBelizeBeninBermudaBhutanBoliviaBosnia and HerzegovinaBotswanaBrazilBrunei DarussalamBulgariaBurkina FasoBurundiCabo VerdeCambodiaCameroonCanadaCaribbean small statesCentral African RepublicCentral Europe and the BalticsChadChileChinaColombiaComorosCongo, Dem. Rep.Congo, Rep.Costa RicaCote d'IvoireCroatiaCubaCyprusCzech RepublicDenmarkDjiboutiDominicaDominican RepublicEarly-demographic dividendEast Asia & PacificEast Asia & Pacific (excluding high income)East Asia & Pacific (IDA & IBRD countries)EcuadorEgypt, Arab Rep.El SalvadorEquatorial GuineaEritreaEstoniaEthiopiaEuro areaEurope & Central AsiaEurope & Central Asia (excluding high income)Europe & Central Asia (IDA & IBRD countries)European UnionFaroe IslandsFijiFinlandFragile and conflict affected situationsFranceFrench PolynesiaGabonGambia, TheGeorgiaGermanyGhanaGreeceGrenadaGuatemalaGuineaGuinea-BissauGuyanaHaitiHeavily indebted poor countries (HIPC)High incomeHondurasHong Kong SAR, ChinaHungaryIBRD onlyIcelandIDA & IBRD totalIDA blendIDA onlyIDA totalIndiaIndonesiaIran, Islamic Rep.IraqIrelandIsraelItalyJamaicaJapanJordanKazakhstanKenyaKiribatiKorea, Rep.KosovoKuwaitKyrgyz RepublicLao PDRLate-demographic dividendLatin America & Caribbean Latin America & Caribbean (excluding high income)Latin America & the Caribbean (IDA & IBRD countries)LatviaLeast developed countries: UN classificationLebanonLesothoLiberiaLibyaLithuaniaLow & middle incomeLow incomeLower middle incomeLuxembourgMacao SAR, ChinaMacedonia, FYRMadagascarMalawiMalaysiaMaldivesMaliMaltaMauritaniaMauritiusMexicoMicronesia, Fed. Sts.Middle East & North AfricaMiddle East & North Africa (excluding high income)Middle East & North Africa (IDA & IBRD countries)Middle incomeMoldovaMongoliaMontenegroMoroccoMozambiqueMyanmarNamibiaNepalNetherlandsNew CaledoniaNew ZealandNicaraguaNigerNigeriaNorth AmericaNorwayOECD membersOmanOther small statesPacific island small statesPakistanPalauPanamaPapua New GuineaParaguayPeruPhilippinesPolandPortugalPost-demographic dividendPre-demographic dividendPuerto RicoQatarRomaniaRussian FederationRwandaSamoaSaudi ArabiaSenegalSerbiaSeychellesSierra LeoneSingaporeSlovak RepublicSloveniaSmall statesSolomon IslandsSomaliaSouth AfricaSouth AsiaSouth Asia (IDA & IBRD)South SudanSpainSri LankaSt. Kitts and NevisSt. LuciaSt. Vincent and the GrenadinesSub-Saharan Africa Sub-Saharan Africa (excluding high income)Sub-Saharan Africa (IDA & IBRD countries)SudanSurinameSwazilandSwedenSwitzerlandSyrian Arab RepublicTajikistanTanzaniaThailandTimor-LesteTogoTongaTrinidad and TobagoTunisiaTurkeyTurkmenistanUgandaUkraineUnited Arab EmiratesUnited KingdomUnited StatesUpper middle incomeUruguayUzbekistanVanuatuVenezuela, RBVietnamWest Bank and GazaWorldYemen, Rep.ZambiaZimbabwe Timeline:
This timeline shows a graph from 1981 to 2016 of Bhutan. No data until 1980. Number of actual observations by date: 36.
Source name:
World Development Indicators
Source organization:
World Bank national accounts data, and OECD National Accounts data files.
Categories, topics:
Economy & Growth, Trade
Last updated:
apr 23, 2017
Indicators value changes by year
Minimum:
12.059
jan 1, 1984
Maximum:
62.608
jan 1, 2007
At the date of observation
Value
Absolute change
Change from previous value
jan 1, 1981
13.645
+13.645
0.0%
jan 1, 1982
15.44
+1.795
13.15%
jan 1, 1983
13.698
-1.742
-11.28%
jan 1, 1984
12.059
-1.639
-11.96%
jan 1, 1985
12.931
+0.872
7.23%
jan 1, 1986
14.993
+2.062
15.95%
jan 1, 1987
17.631
+2.638
17.59%
jan 1, 1988
23.547
+5.916
33.56%
jan 1, 1989
28.073
+4.526
19.22%
jan 1, 1990
28.048
-0.025
-0.09%
jan 1, 1991
26.83
-1.217
-4.34%
jan 1, 1992
32.158
+5.328
19.86%
jan 1, 1993
31.986
-0.172
-0.53%
jan 1, 1994
31.568
-0.418
-1.31%
jan 1, 1995
29.529
-2.04
-6.46%
jan 1, 1996
37.769
+8.24
27.91%
jan 1, 1997
35.488
-2.281
-6.04%
jan 1, 1998
35.905
+0.417
1.17%
jan 1, 1999
33.1
-2.805
-7.81%
jan 1, 2000
31.114
-1.986
-6.0%
jan 1, 2001
28.984
-2.13
-6.85%
jan 1, 2002
28.583
-0.402
-1.39%
jan 1, 2003
24.92
-3.662
-12.81%
jan 1, 2004
26.193
+1.273
5.11%
jan 1, 2005
31.569
+5.375
20.52%
jan 1, 2006
39.061
+7.492
23.73%
jan 1, 2007
62.608
+23.547
60.28%
jan 1, 2008
41.651
-20.957
-33.47%
jan 1, 2009
48.79
+7.139
17.14%
jan 1, 2010
44.702
-4.088
-8.38%
jan 1, 2011
42.453
-2.249
-5.03%
jan 1, 2012
41.205
-1.247
-2.94%
jan 1, 2013
38.725
-2.48
-6.02%
jan 1, 2014
40.46
+1.735
4.48%
jan 1, 2015
36.285
-4.175
-10.32%
jan 1, 2016
32.884
-3.4
-9.37%
Ranking of countries by current statistics by years


Comments: