29
/
en
AIzaSyAYiBZKx7MnpbEhh9jyipgxe19OcubqV5w
April 1, 2024
212883
Nigeria
NGA
true
2
1
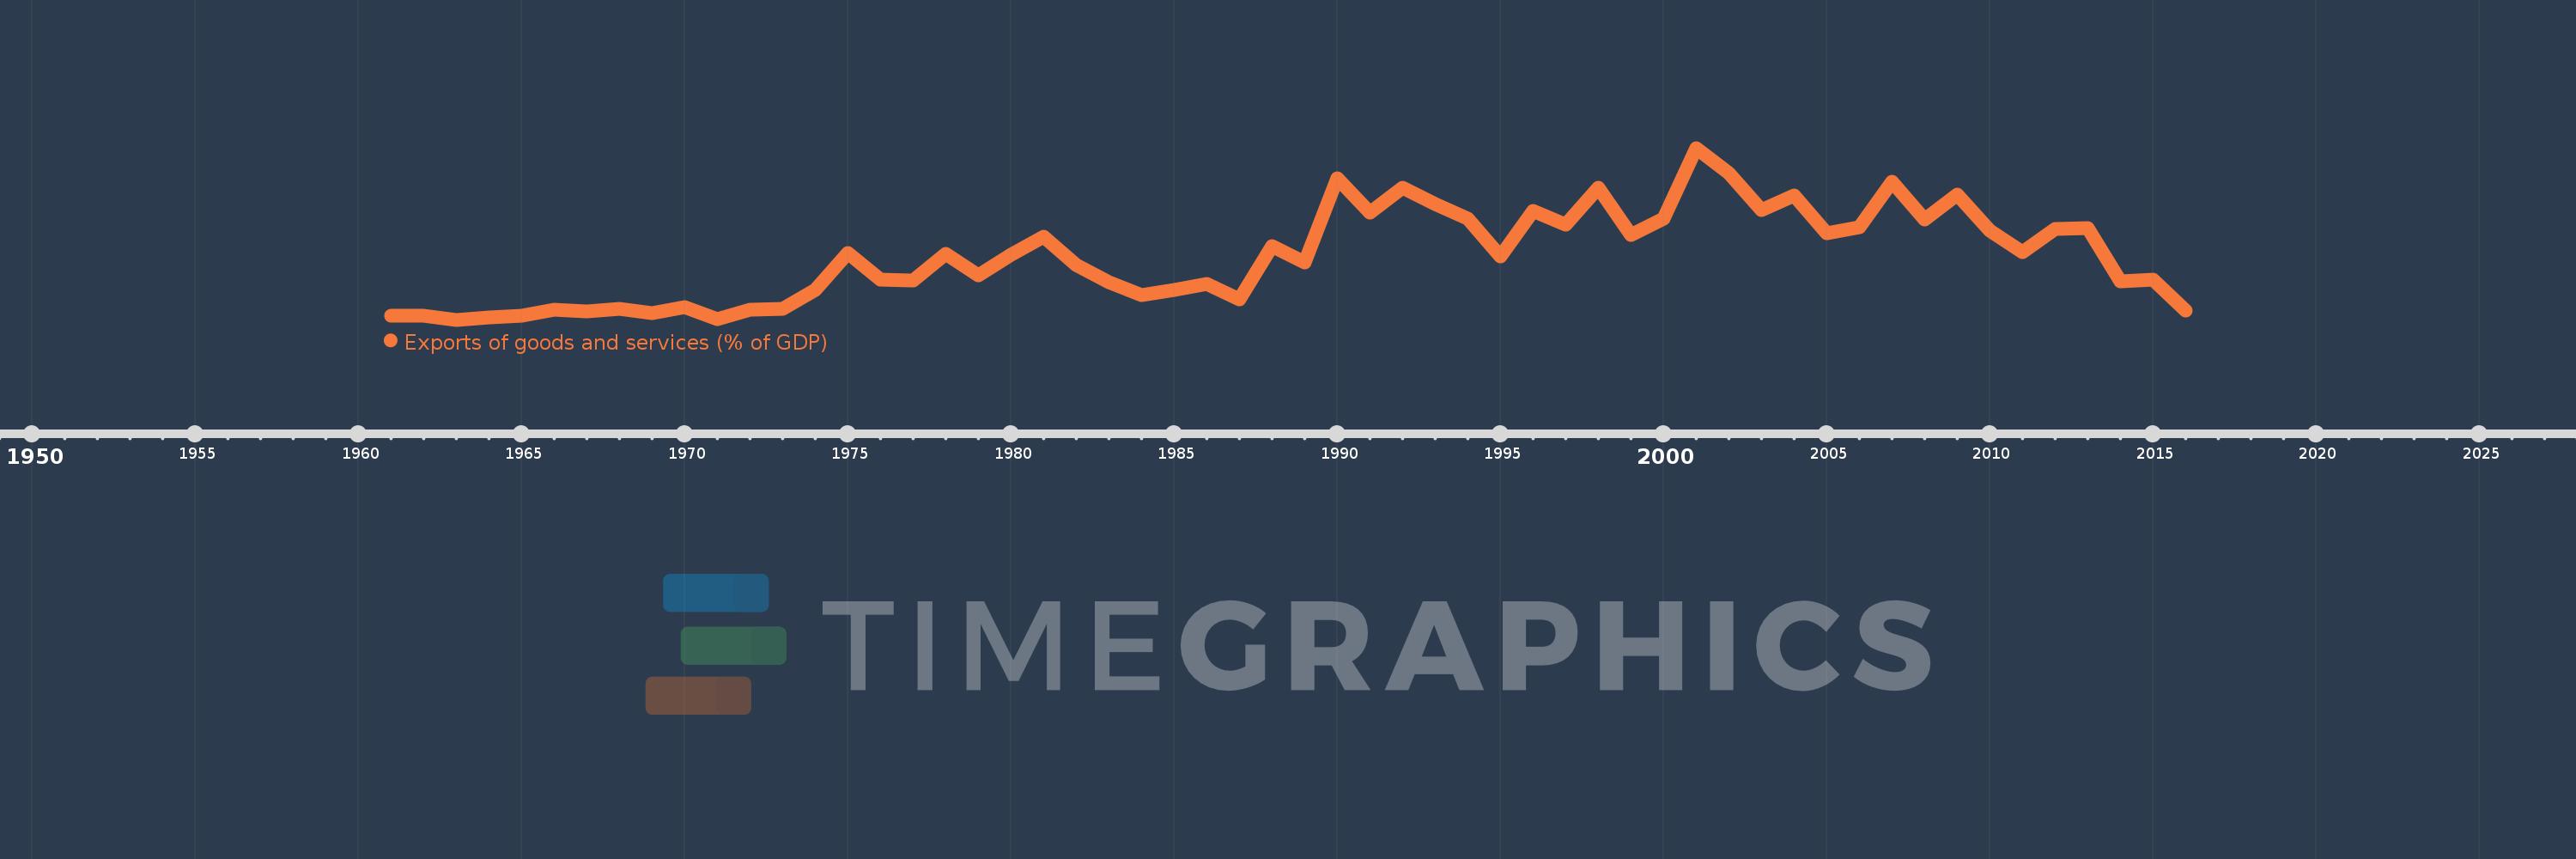
Exports of goods and services (% of GDP)
2016,2015,2014,2013,2012,2011,2010,2009,2008,2007,2006,2005,2004,2003,2002,2001,2000,1999,1998,1997,1996,1995,1994,1993,1992,1991,1990,1989,1988,1987,1986,1985,1984,1983,1982,1981,1980,1979,1978,1977,1976,1975,1974,1973,1972,1971,1970,1969,1968,1967,1966,1965,1964,1963,1962,1961
This statistics in other country:
AfghanistanAlbaniaAlgeriaAngolaAntigua and BarbudaArab WorldArgentinaArmeniaArubaAustraliaAustriaAzerbaijanBahamas, TheBahrainBangladeshBarbadosBelarusBelgiumBelizeBeninBermudaBhutanBoliviaBosnia and HerzegovinaBotswanaBrazilBrunei DarussalamBulgariaBurkina FasoBurundiCabo VerdeCambodiaCameroonCanadaCaribbean small statesCentral African RepublicCentral Europe and the BalticsChadChileChinaColombiaComorosCongo, Dem. Rep.Congo, Rep.Costa RicaCote d'IvoireCroatiaCubaCyprusCzech RepublicDenmarkDjiboutiDominicaDominican RepublicEarly-demographic dividendEast Asia & PacificEast Asia & Pacific (excluding high income)East Asia & Pacific (IDA & IBRD countries)EcuadorEgypt, Arab Rep.El SalvadorEquatorial GuineaEritreaEstoniaEthiopiaEuro areaEurope & Central AsiaEurope & Central Asia (excluding high income)Europe & Central Asia (IDA & IBRD countries)European UnionFaroe IslandsFijiFinlandFragile and conflict affected situationsFranceFrench PolynesiaGabonGambia, TheGeorgiaGermanyGhanaGreeceGrenadaGuatemalaGuineaGuinea-BissauGuyanaHaitiHeavily indebted poor countries (HIPC)High incomeHondurasHong Kong SAR, ChinaHungaryIBRD onlyIcelandIDA & IBRD totalIDA blendIDA onlyIDA totalIndiaIndonesiaIran, Islamic Rep.IraqIrelandIsraelItalyJamaicaJapanJordanKazakhstanKenyaKiribatiKorea, Rep.KosovoKuwaitKyrgyz RepublicLao PDRLate-demographic dividendLatin America & Caribbean Latin America & Caribbean (excluding high income)Latin America & the Caribbean (IDA & IBRD countries)LatviaLeast developed countries: UN classificationLebanonLesothoLiberiaLibyaLithuaniaLow & middle incomeLow incomeLower middle incomeLuxembourgMacao SAR, ChinaMacedonia, FYRMadagascarMalawiMalaysiaMaldivesMaliMaltaMauritaniaMauritiusMexicoMicronesia, Fed. Sts.Middle East & North AfricaMiddle East & North Africa (excluding high income)Middle East & North Africa (IDA & IBRD countries)Middle incomeMoldovaMongoliaMontenegroMoroccoMozambiqueMyanmarNamibiaNepalNetherlandsNew CaledoniaNew ZealandNicaraguaNigerNigeriaNorth AmericaNorwayOECD membersOmanOther small statesPacific island small statesPakistanPalauPanamaPapua New GuineaParaguayPeruPhilippinesPolandPortugalPost-demographic dividendPre-demographic dividendPuerto RicoQatarRomaniaRussian FederationRwandaSamoaSaudi ArabiaSenegalSerbiaSeychellesSierra LeoneSingaporeSlovak RepublicSloveniaSmall statesSolomon IslandsSomaliaSouth AfricaSouth AsiaSouth Asia (IDA & IBRD)South SudanSpainSri LankaSt. Kitts and NevisSt. LuciaSt. Vincent and the GrenadinesSub-Saharan Africa Sub-Saharan Africa (excluding high income)Sub-Saharan Africa (IDA & IBRD countries)SudanSurinameSwazilandSwedenSwitzerlandSyrian Arab RepublicTajikistanTanzaniaThailandTimor-LesteTogoTongaTrinidad and TobagoTunisiaTurkeyTurkmenistanUgandaUkraineUnited Arab EmiratesUnited KingdomUnited StatesUpper middle incomeUruguayUzbekistanVanuatuVenezuela, RBVietnamWest Bank and GazaWorldYemen, Rep.ZambiaZimbabwe Timeline:
This timeline shows a graph from 1961 to 2016 of Nigeria. No data until 1960. Number of actual observations by date: 56.
Source name:
World Development Indicators
Source organization:
World Bank national accounts data, and OECD National Accounts data files.
Categories, topics:
Economy & Growth, Trade
Last updated:
apr 23, 2017
Indicators value changes by year
At the date of observation
Value
Absolute change
Change from previous value
jan 1, 1961
9.242
+9.242
0.0%
jan 1, 1962
9.185
-0.056
-0.61%
jan 1, 1963
8.269
-0.916
-9.97%
jan 1, 1964
8.779
+0.51
6.17%
jan 1, 1965
9.202
+0.423
4.82%
jan 1, 1966
10.893
+1.691
18.38%
jan 1, 1967
10.414
-0.48
-4.4%
jan 1, 1968
11.077
+0.664
6.37%
jan 1, 1969
9.927
-1.15
-10.38%
jan 1, 1970
11.391
+1.464
14.74%
jan 1, 1971
8.407
-2.984
-26.2%
jan 1, 1972
10.834
+2.427
28.87%
jan 1, 1973
10.968
+0.134
1.24%
jan 1, 1974
15.918
+4.95
45.13%
jan 1, 1975
25.179
+9.261
58.18%
jan 1, 1976
18.339
-6.84
-27.17%
jan 1, 1977
18.216
-0.123
-0.67%
jan 1, 1978
24.872
+6.657
36.54%
jan 1, 1979
19.553
-5.32
-21.39%
jan 1, 1980
24.816
+5.264
26.92%
jan 1, 1981
29.375
+4.559
18.37%
jan 1, 1982
22.188
-7.188
-24.47%
jan 1, 1983
17.834
-4.354
-19.62%
jan 1, 1984
14.536
-3.298
-18.49%
jan 1, 1985
15.705
+1.169
8.04%
jan 1, 1986
17.385
+1.68
10.7%
jan 1, 1987
13.316
-4.069
-23.41%
jan 1, 1988
26.942
+13.626
102.33%
jan 1, 1989
22.855
-4.087
-15.17%
jan 1, 1990
43.981
+21.127
92.44%
jan 1, 1991
35.344
-8.637
-19.64%
jan 1, 1992
41.701
+6.357
17.99%
jan 1, 1993
37.509
-4.192
-10.05%
jan 1, 1994
33.83
-3.68
-9.81%
jan 1, 1995
24.31
-9.52
-28.14%
jan 1, 1996
35.761
+11.451
47.1%
jan 1, 1997
32.239
-3.523
-9.85%
jan 1, 1998
41.775
+9.536
29.58%
jan 1, 1999
29.692
-12.083
-28.92%
jan 1, 2000
33.87
+4.178
14.07%
jan 1, 2001
51.73
+17.861
52.73%
jan 1, 2002
45.448
-6.282
-12.14%
jan 1, 2003
35.966
-9.482
-20.86%
jan 1, 2004
39.788
+3.822
10.63%
jan 1, 2005
30.161
-9.627
-24.2%
jan 1, 2006
31.657
+1.496
4.96%
jan 1, 2007
43.111
+11.454
36.18%
jan 1, 2008
33.729
-9.383
-21.76%
jan 1, 2009
39.883
+6.155
18.25%
jan 1, 2010
30.769
-9.115
-22.85%
jan 1, 2011
25.264
-5.505
-17.89%
jan 1, 2012
31.33
+6.066
24.01%
jan 1, 2013
31.439
+0.109
0.35%
jan 1, 2014
18.05
-13.389
-42.59%
jan 1, 2015
18.435
+0.385
2.13%
jan 1, 2016
10.657
-7.778
-42.19%
Ranking of countries by current statistics by years


Comments: