29
/
en
AIzaSyAYiBZKx7MnpbEhh9jyipgxe19OcubqV5w
April 1, 2024
52563
OECD members
OED
false
2
1
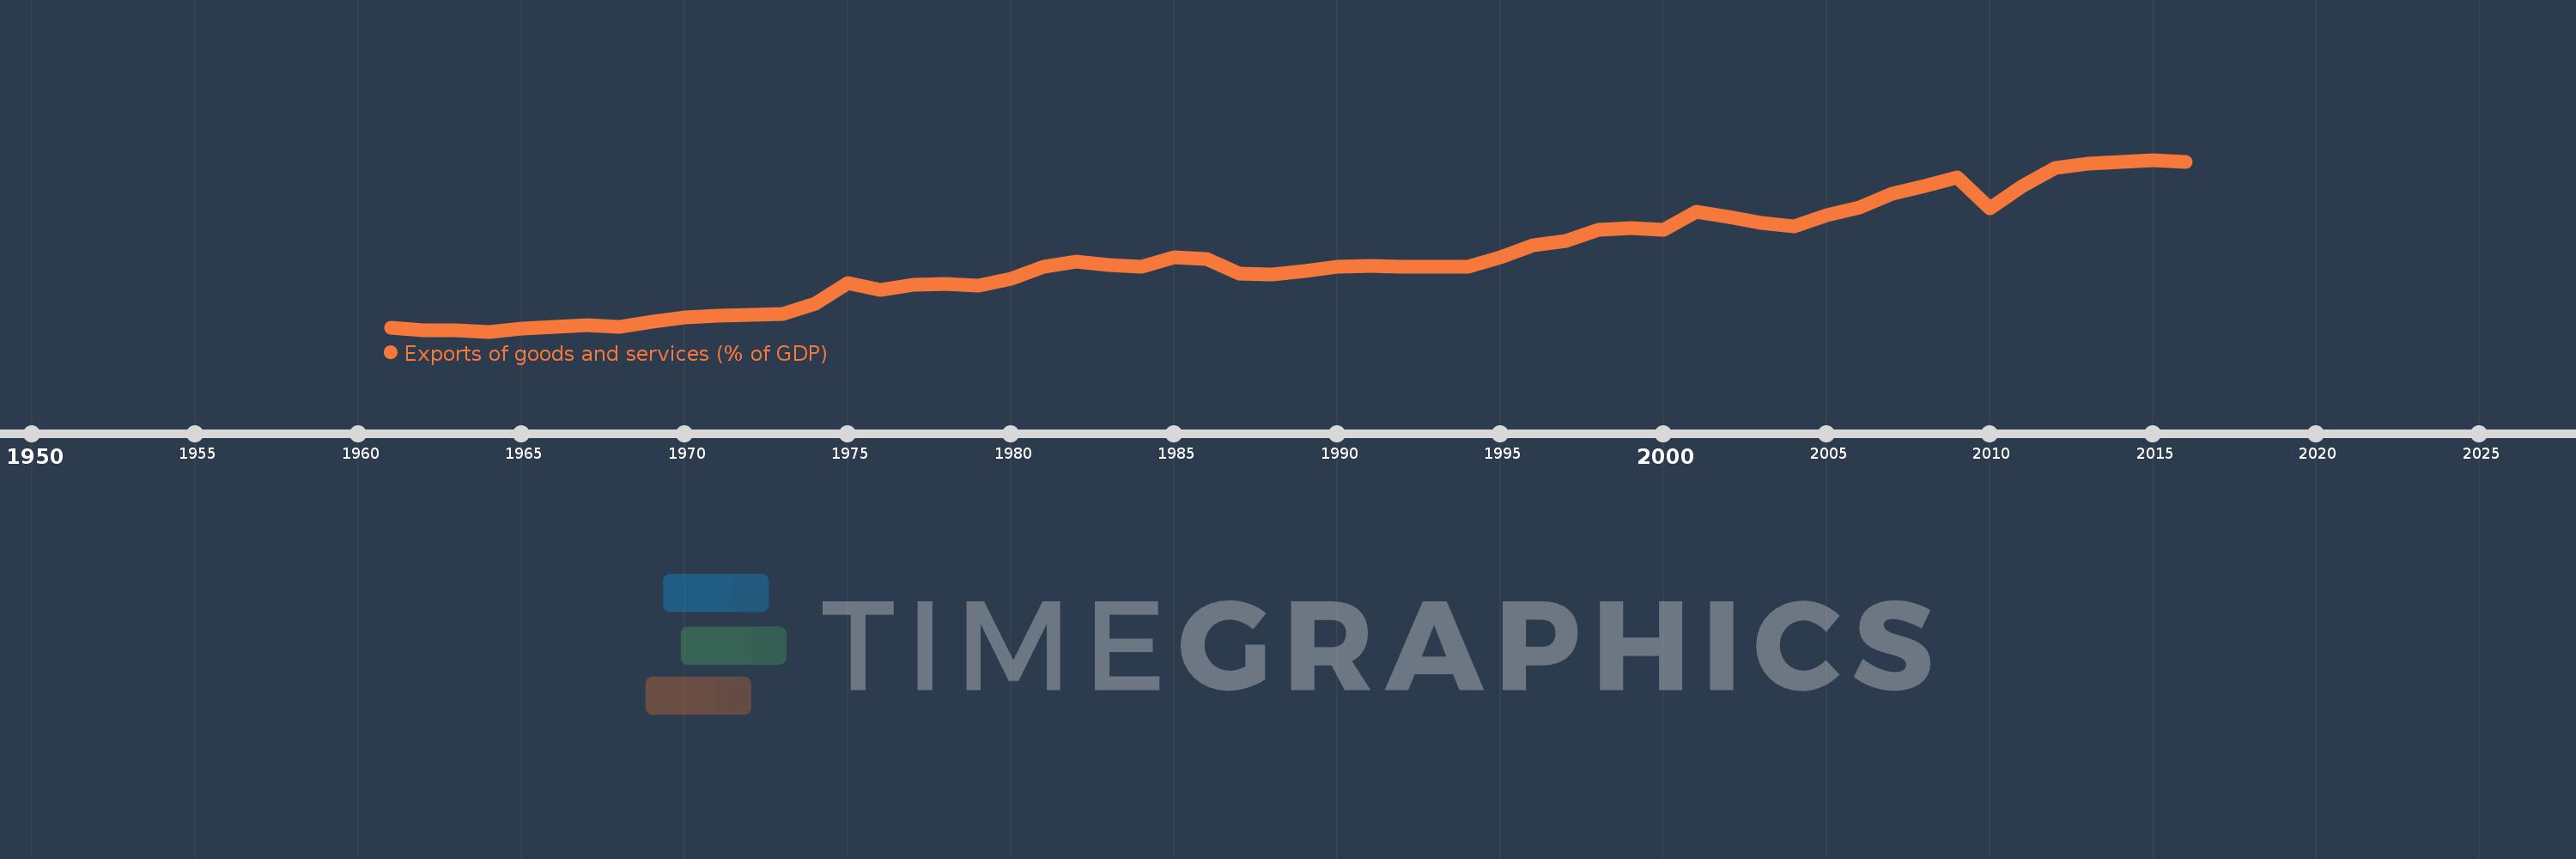
Exports of goods and services (% of GDP)
2016,2015,2014,2013,2012,2011,2010,2009,2008,2007,2006,2005,2004,2003,2002,2001,2000,1999,1998,1997,1996,1995,1994,1993,1992,1991,1990,1989,1988,1987,1986,1985,1984,1983,1982,1981,1980,1979,1978,1977,1976,1975,1974,1973,1972,1971,1970,1969,1968,1967,1966,1965,1964,1963,1962,1961
This statistics in other country:
AfghanistanAlbaniaAlgeriaAngolaAntigua and BarbudaArab WorldArgentinaArmeniaArubaAustraliaAustriaAzerbaijanBahamas, TheBahrainBangladeshBarbadosBelarusBelgiumBelizeBeninBermudaBhutanBoliviaBosnia and HerzegovinaBotswanaBrazilBrunei DarussalamBulgariaBurkina FasoBurundiCabo VerdeCambodiaCameroonCanadaCaribbean small statesCentral African RepublicCentral Europe and the BalticsChadChileChinaColombiaComorosCongo, Dem. Rep.Congo, Rep.Costa RicaCote d'IvoireCroatiaCubaCyprusCzech RepublicDenmarkDjiboutiDominicaDominican RepublicEarly-demographic dividendEast Asia & PacificEast Asia & Pacific (excluding high income)East Asia & Pacific (IDA & IBRD countries)EcuadorEgypt, Arab Rep.El SalvadorEquatorial GuineaEritreaEstoniaEthiopiaEuro areaEurope & Central AsiaEurope & Central Asia (excluding high income)Europe & Central Asia (IDA & IBRD countries)European UnionFaroe IslandsFijiFinlandFragile and conflict affected situationsFranceFrench PolynesiaGabonGambia, TheGeorgiaGermanyGhanaGreeceGrenadaGuatemalaGuineaGuinea-BissauGuyanaHaitiHeavily indebted poor countries (HIPC)High incomeHondurasHong Kong SAR, ChinaHungaryIBRD onlyIcelandIDA & IBRD totalIDA blendIDA onlyIDA totalIndiaIndonesiaIran, Islamic Rep.IraqIrelandIsraelItalyJamaicaJapanJordanKazakhstanKenyaKiribatiKorea, Rep.KosovoKuwaitKyrgyz RepublicLao PDRLate-demographic dividendLatin America & Caribbean Latin America & Caribbean (excluding high income)Latin America & the Caribbean (IDA & IBRD countries)LatviaLeast developed countries: UN classificationLebanonLesothoLiberiaLibyaLithuaniaLow & middle incomeLow incomeLower middle incomeLuxembourgMacao SAR, ChinaMacedonia, FYRMadagascarMalawiMalaysiaMaldivesMaliMaltaMauritaniaMauritiusMexicoMicronesia, Fed. Sts.Middle East & North AfricaMiddle East & North Africa (excluding high income)Middle East & North Africa (IDA & IBRD countries)Middle incomeMoldovaMongoliaMontenegroMoroccoMozambiqueMyanmarNamibiaNepalNetherlandsNew CaledoniaNew ZealandNicaraguaNigerNigeriaNorth AmericaNorwayOECD membersOmanOther small statesPacific island small statesPakistanPalauPanamaPapua New GuineaParaguayPeruPhilippinesPolandPortugalPost-demographic dividendPre-demographic dividendPuerto RicoQatarRomaniaRussian FederationRwandaSamoaSaudi ArabiaSenegalSerbiaSeychellesSierra LeoneSingaporeSlovak RepublicSloveniaSmall statesSolomon IslandsSomaliaSouth AfricaSouth AsiaSouth Asia (IDA & IBRD)South SudanSpainSri LankaSt. Kitts and NevisSt. LuciaSt. Vincent and the GrenadinesSub-Saharan Africa Sub-Saharan Africa (excluding high income)Sub-Saharan Africa (IDA & IBRD countries)SudanSurinameSwazilandSwedenSwitzerlandSyrian Arab RepublicTajikistanTanzaniaThailandTimor-LesteTogoTongaTrinidad and TobagoTunisiaTurkeyTurkmenistanUgandaUkraineUnited Arab EmiratesUnited KingdomUnited StatesUpper middle incomeUruguayUzbekistanVanuatuVenezuela, RBVietnamWest Bank and GazaWorldYemen, Rep.ZambiaZimbabwe Timeline:
This timeline shows a graph from 1961 to 2016 of OECD members. No data until 1960. Number of actual observations by date: 56.
Source name:
World Development Indicators
Source organization:
World Bank national accounts data, and OECD National Accounts data files.
Categories, topics:
Economy & Growth, Trade
Last updated:
apr 23, 2017
Indicators value changes by year
Minimum:
11.364
jan 1, 1964
Maximum:
28.781
jan 1, 2015
At the date of observation
Value
Absolute change
Change from previous value
jan 1, 1961
11.776
+11.776
0.0%
jan 1, 1962
11.533
-0.243
-2.06%
jan 1, 1963
11.466
-0.067
-0.58%
jan 1, 1964
11.364
-0.101
-0.88%
jan 1, 1965
11.672
+0.307
2.7%
jan 1, 1966
11.837
+0.165
1.42%
jan 1, 1967
12.008
+0.171
1.45%
jan 1, 1968
11.858
-0.151
-1.25%
jan 1, 1969
12.372
+0.515
4.34%
jan 1, 1970
12.787
+0.415
3.35%
jan 1, 1971
13.004
+0.217
1.7%
jan 1, 1972
13.102
+0.098
0.75%
jan 1, 1973
13.146
+0.045
0.34%
jan 1, 1974
14.224
+1.077
8.19%
jan 1, 1975
16.322
+2.098
14.75%
jan 1, 1976
15.562
-0.76
-4.66%
jan 1, 1977
16.087
+0.525
3.38%
jan 1, 1978
16.188
+0.101
0.63%
jan 1, 1979
15.986
-0.202
-1.25%
jan 1, 1980
16.686
+0.7
4.38%
jan 1, 1981
17.955
+1.268
7.6%
jan 1, 1982
18.451
+0.496
2.76%
jan 1, 1983
18.117
-0.334
-1.81%
jan 1, 1984
17.981
-0.135
-0.75%
jan 1, 1985
18.918
+0.937
5.21%
jan 1, 1986
18.761
-0.157
-0.83%
jan 1, 1987
17.215
-1.546
-8.24%
jan 1, 1988
17.134
-0.081
-0.47%
jan 1, 1989
17.499
+0.365
2.13%
jan 1, 1990
17.957
+0.458
2.62%
jan 1, 1991
18.02
+0.063
0.35%
jan 1, 1992
17.975
-0.045
-0.25%
jan 1, 1993
17.977
+0.002
0.01%
jan 1, 1994
17.975
-0.002
-0.01%
jan 1, 1995
18.894
+0.919
5.11%
jan 1, 1996
20.151
+1.258
6.66%
jan 1, 1997
20.51
+0.359
1.78%
jan 1, 1998
21.688
+1.178
5.74%
jan 1, 1999
21.892
+0.204
0.94%
jan 1, 2000
21.706
-0.186
-0.85%
jan 1, 2001
23.476
+1.77
8.16%
jan 1, 2002
23.01
-0.466
-1.99%
jan 1, 2003
22.363
-0.647
-2.81%
jan 1, 2004
22.02
-0.343
-1.53%
jan 1, 2005
23.152
+1.132
5.14%
jan 1, 2006
23.955
+0.803
3.47%
jan 1, 2007
25.326
+1.371
5.72%
jan 1, 2008
26.122
+0.795
3.14%
jan 1, 2009
27.014
+0.892
3.42%
jan 1, 2010
23.846
-3.168
-11.73%
jan 1, 2011
26.161
+2.315
9.71%
jan 1, 2012
27.935
+1.774
6.78%
jan 1, 2013
28.418
+0.484
1.73%
jan 1, 2014
28.547
+0.128
0.45%
jan 1, 2015
28.781
+0.235
0.82%
jan 1, 2016
28.549
-0.233
-0.81%
Ranking of countries by current statistics by years


Comments: