29
/
en
AIzaSyAYiBZKx7MnpbEhh9jyipgxe19OcubqV5w
April 1, 2024
89728
Botswana
BWA
true
2
1
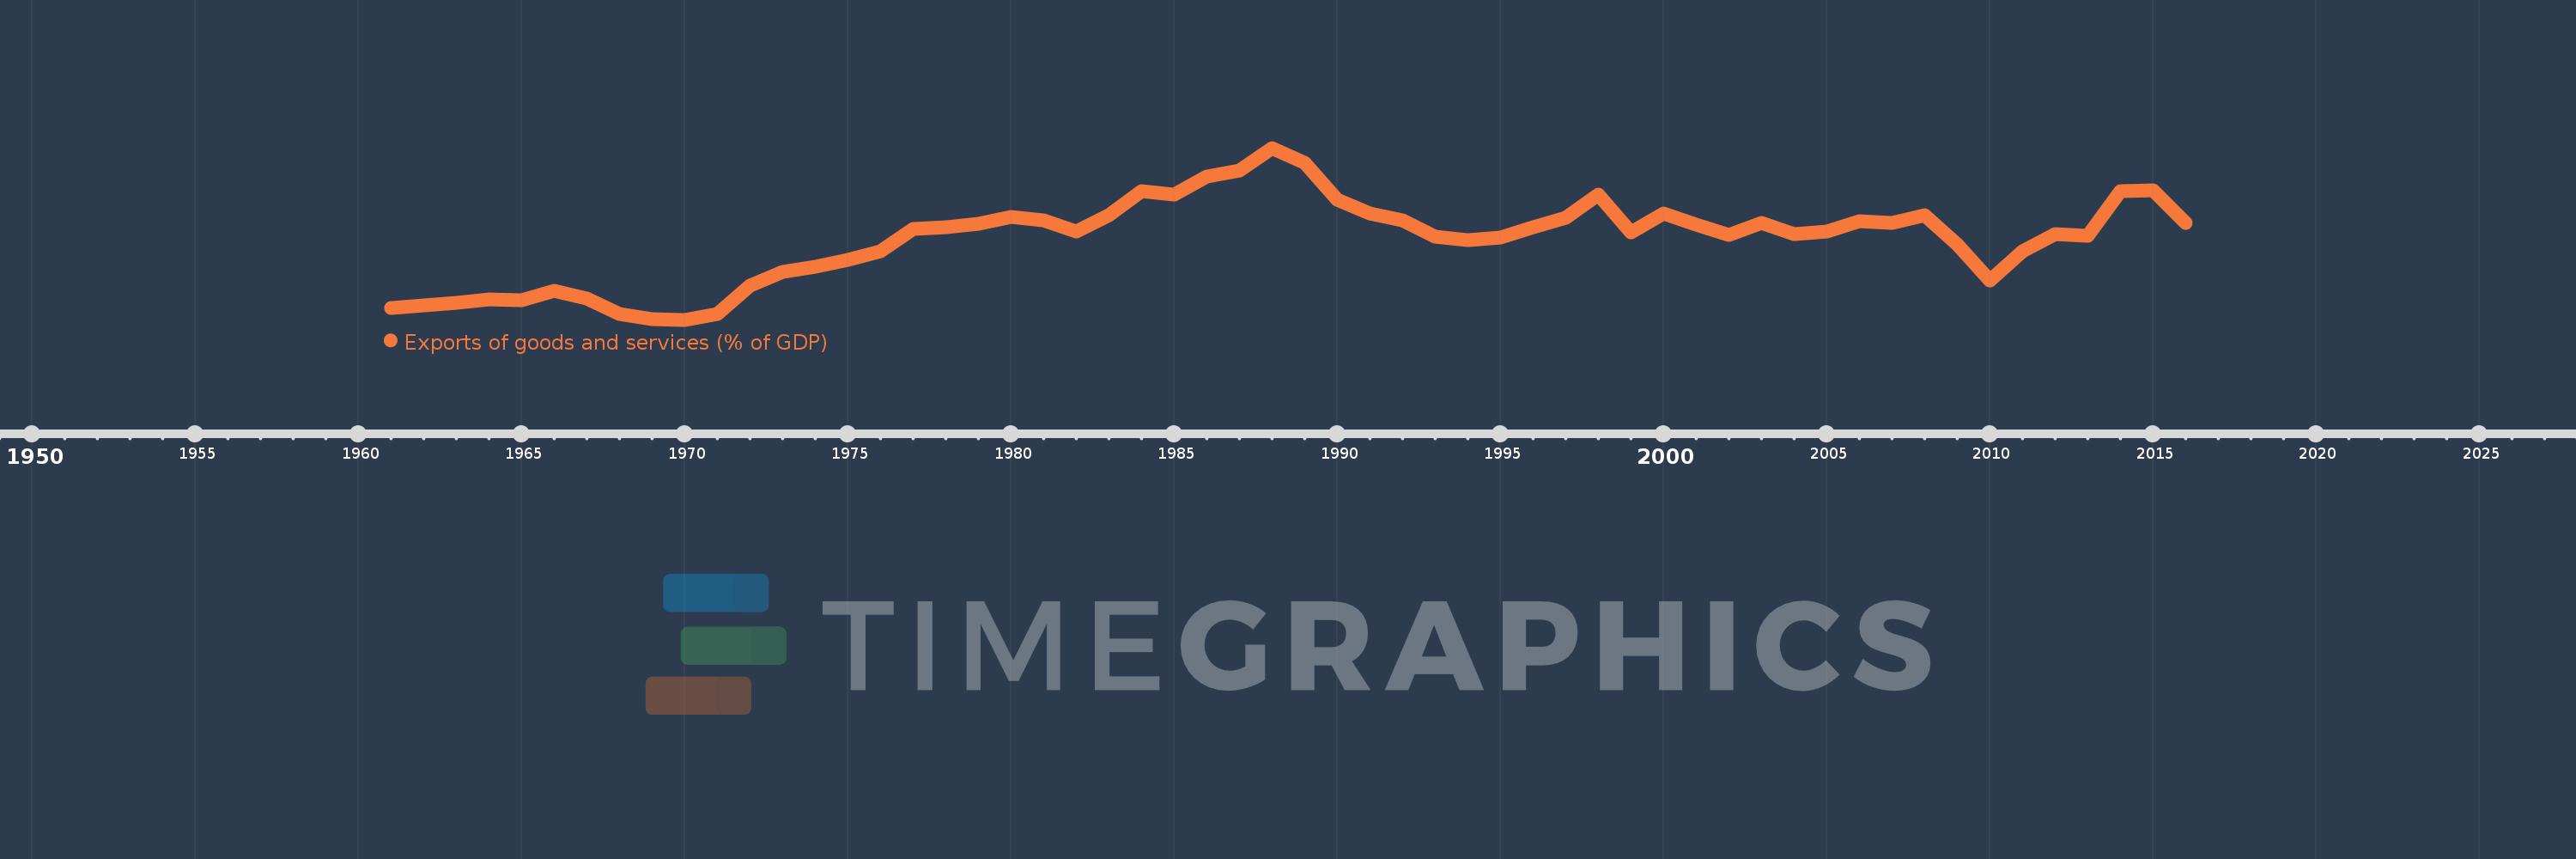
Exports of goods and services (% of GDP)
2016,2015,2014,2013,2012,2011,2010,2009,2008,2007,2006,2005,2004,2003,2002,2001,2000,1999,1998,1997,1996,1995,1994,1993,1992,1991,1990,1989,1988,1987,1986,1985,1984,1983,1982,1981,1980,1979,1978,1977,1976,1975,1974,1973,1972,1971,1970,1969,1968,1967,1966,1965,1964,1963,1962,1961
This statistics in other country:
AfghanistanAlbaniaAlgeriaAngolaAntigua and BarbudaArab WorldArgentinaArmeniaArubaAustraliaAustriaAzerbaijanBahamas, TheBahrainBangladeshBarbadosBelarusBelgiumBelizeBeninBermudaBhutanBoliviaBosnia and HerzegovinaBotswanaBrazilBrunei DarussalamBulgariaBurkina FasoBurundiCabo VerdeCambodiaCameroonCanadaCaribbean small statesCentral African RepublicCentral Europe and the BalticsChadChileChinaColombiaComorosCongo, Dem. Rep.Congo, Rep.Costa RicaCote d'IvoireCroatiaCubaCyprusCzech RepublicDenmarkDjiboutiDominicaDominican RepublicEarly-demographic dividendEast Asia & PacificEast Asia & Pacific (excluding high income)East Asia & Pacific (IDA & IBRD countries)EcuadorEgypt, Arab Rep.El SalvadorEquatorial GuineaEritreaEstoniaEthiopiaEuro areaEurope & Central AsiaEurope & Central Asia (excluding high income)Europe & Central Asia (IDA & IBRD countries)European UnionFaroe IslandsFijiFinlandFragile and conflict affected situationsFranceFrench PolynesiaGabonGambia, TheGeorgiaGermanyGhanaGreeceGrenadaGuatemalaGuineaGuinea-BissauGuyanaHaitiHeavily indebted poor countries (HIPC)High incomeHondurasHong Kong SAR, ChinaHungaryIBRD onlyIcelandIDA & IBRD totalIDA blendIDA onlyIDA totalIndiaIndonesiaIran, Islamic Rep.IraqIrelandIsraelItalyJamaicaJapanJordanKazakhstanKenyaKiribatiKorea, Rep.KosovoKuwaitKyrgyz RepublicLao PDRLate-demographic dividendLatin America & Caribbean Latin America & Caribbean (excluding high income)Latin America & the Caribbean (IDA & IBRD countries)LatviaLeast developed countries: UN classificationLebanonLesothoLiberiaLibyaLithuaniaLow & middle incomeLow incomeLower middle incomeLuxembourgMacao SAR, ChinaMacedonia, FYRMadagascarMalawiMalaysiaMaldivesMaliMaltaMauritaniaMauritiusMexicoMicronesia, Fed. Sts.Middle East & North AfricaMiddle East & North Africa (excluding high income)Middle East & North Africa (IDA & IBRD countries)Middle incomeMoldovaMongoliaMontenegroMoroccoMozambiqueMyanmarNamibiaNepalNetherlandsNew CaledoniaNew ZealandNicaraguaNigerNigeriaNorth AmericaNorwayOECD membersOmanOther small statesPacific island small statesPakistanPalauPanamaPapua New GuineaParaguayPeruPhilippinesPolandPortugalPost-demographic dividendPre-demographic dividendPuerto RicoQatarRomaniaRussian FederationRwandaSamoaSaudi ArabiaSenegalSerbiaSeychellesSierra LeoneSingaporeSlovak RepublicSloveniaSmall statesSolomon IslandsSomaliaSouth AfricaSouth AsiaSouth Asia (IDA & IBRD)South SudanSpainSri LankaSt. Kitts and NevisSt. LuciaSt. Vincent and the GrenadinesSub-Saharan Africa Sub-Saharan Africa (excluding high income)Sub-Saharan Africa (IDA & IBRD countries)SudanSurinameSwazilandSwedenSwitzerlandSyrian Arab RepublicTajikistanTanzaniaThailandTimor-LesteTogoTongaTrinidad and TobagoTunisiaTurkeyTurkmenistanUgandaUkraineUnited Arab EmiratesUnited KingdomUnited StatesUpper middle incomeUruguayUzbekistanVanuatuVenezuela, RBVietnamWest Bank and GazaWorldYemen, Rep.ZambiaZimbabwe Timeline:
This timeline shows a graph from 1961 to 2016 of Botswana. No data until 1960. Number of actual observations by date: 56.
Source name:
World Development Indicators
Source organization:
World Bank national accounts data, and OECD National Accounts data files.
Categories, topics:
Economy & Growth, Trade
Last updated:
apr 23, 2017
Indicators value changes by year
Minimum:
22.772
jan 1, 1970
At the date of observation
Value
Absolute change
Change from previous value
jan 1, 1961
26.276
+26.276
0.0%
jan 1, 1962
27.216
+0.941
3.58%
jan 1, 1963
27.926
+0.71
2.61%
jan 1, 1964
28.994
+1.068
3.83%
jan 1, 1965
28.811
-0.183
-0.63%
jan 1, 1966
31.707
+2.896
10.05%
jan 1, 1967
29.268
-2.439
-7.69%
jan 1, 1968
24.614
-4.654
-15.9%
jan 1, 1969
23.053
-1.561
-6.34%
jan 1, 1970
22.772
-0.28
-1.22%
jan 1, 1971
24.656
+1.883
8.27%
jan 1, 1972
33.15
+8.494
34.45%
jan 1, 1973
37.372
+4.222
12.74%
jan 1, 1974
38.832
+1.459
3.9%
jan 1, 1975
40.923
+2.092
5.39%
jan 1, 1976
43.594
+2.671
6.53%
jan 1, 1977
50.386
+6.792
15.58%
jan 1, 1978
50.901
+0.514
1.02%
jan 1, 1979
52.061
+1.16
2.28%
jan 1, 1980
54.123
+2.062
3.96%
jan 1, 1981
53.059
-1.064
-1.97%
jan 1, 1982
49.705
-3.354
-6.32%
jan 1, 1983
54.562
+4.857
9.77%
jan 1, 1984
62.083
+7.521
13.79%
jan 1, 1985
60.811
-1.272
-2.05%
jan 1, 1986
66.291
+5.48
9.01%
jan 1, 1987
68.331
+2.04
3.08%
jan 1, 1988
75.13
+6.799
9.95%
jan 1, 1989
70.522
-4.608
-6.13%
jan 1, 1990
59.225
-11.297
-16.02%
jan 1, 1991
55.055
-4.169
-7.04%
jan 1, 1992
53.03
-2.026
-3.68%
jan 1, 1993
48.18
-4.85
-9.15%
jan 1, 1994
47.096
-1.084
-2.25%
jan 1, 1995
47.822
+0.727
1.54%
jan 1, 1996
50.836
+3.014
6.3%
jan 1, 1997
53.828
+2.992
5.89%
jan 1, 1998
60.881
+7.052
13.1%
jan 1, 1999
49.289
-11.592
-19.04%
jan 1, 2000
55.197
+5.908
11.99%
jan 1, 2001
51.832
-3.365
-6.1%
jan 1, 2002
48.658
-3.174
-6.12%
jan 1, 2003
52.157
+3.5
7.19%
jan 1, 2004
48.827
-3.331
-6.39%
jan 1, 2005
49.614
+0.787
1.61%
jan 1, 2006
52.924
+3.31
6.67%
jan 1, 2007
52.254
-0.669
-1.26%
jan 1, 2008
54.516
+2.262
4.33%
jan 1, 2009
45.674
-8.842
-16.22%
jan 1, 2010
34.801
-10.873
-23.81%
jan 1, 2011
43.635
+8.835
25.39%
jan 1, 2012
48.896
+5.261
12.06%
jan 1, 2013
48.359
-0.537
-1.1%
jan 1, 2014
61.932
+13.573
28.07%
jan 1, 2015
62.283
+0.351
0.57%
jan 1, 2016
52.31
-9.973
-16.01%
Ranking of countries by current statistics by years


Comments: