29
/
en
AIzaSyAYiBZKx7MnpbEhh9jyipgxe19OcubqV5w
April 1, 2024
163703
Japan
JPN
true
2
1
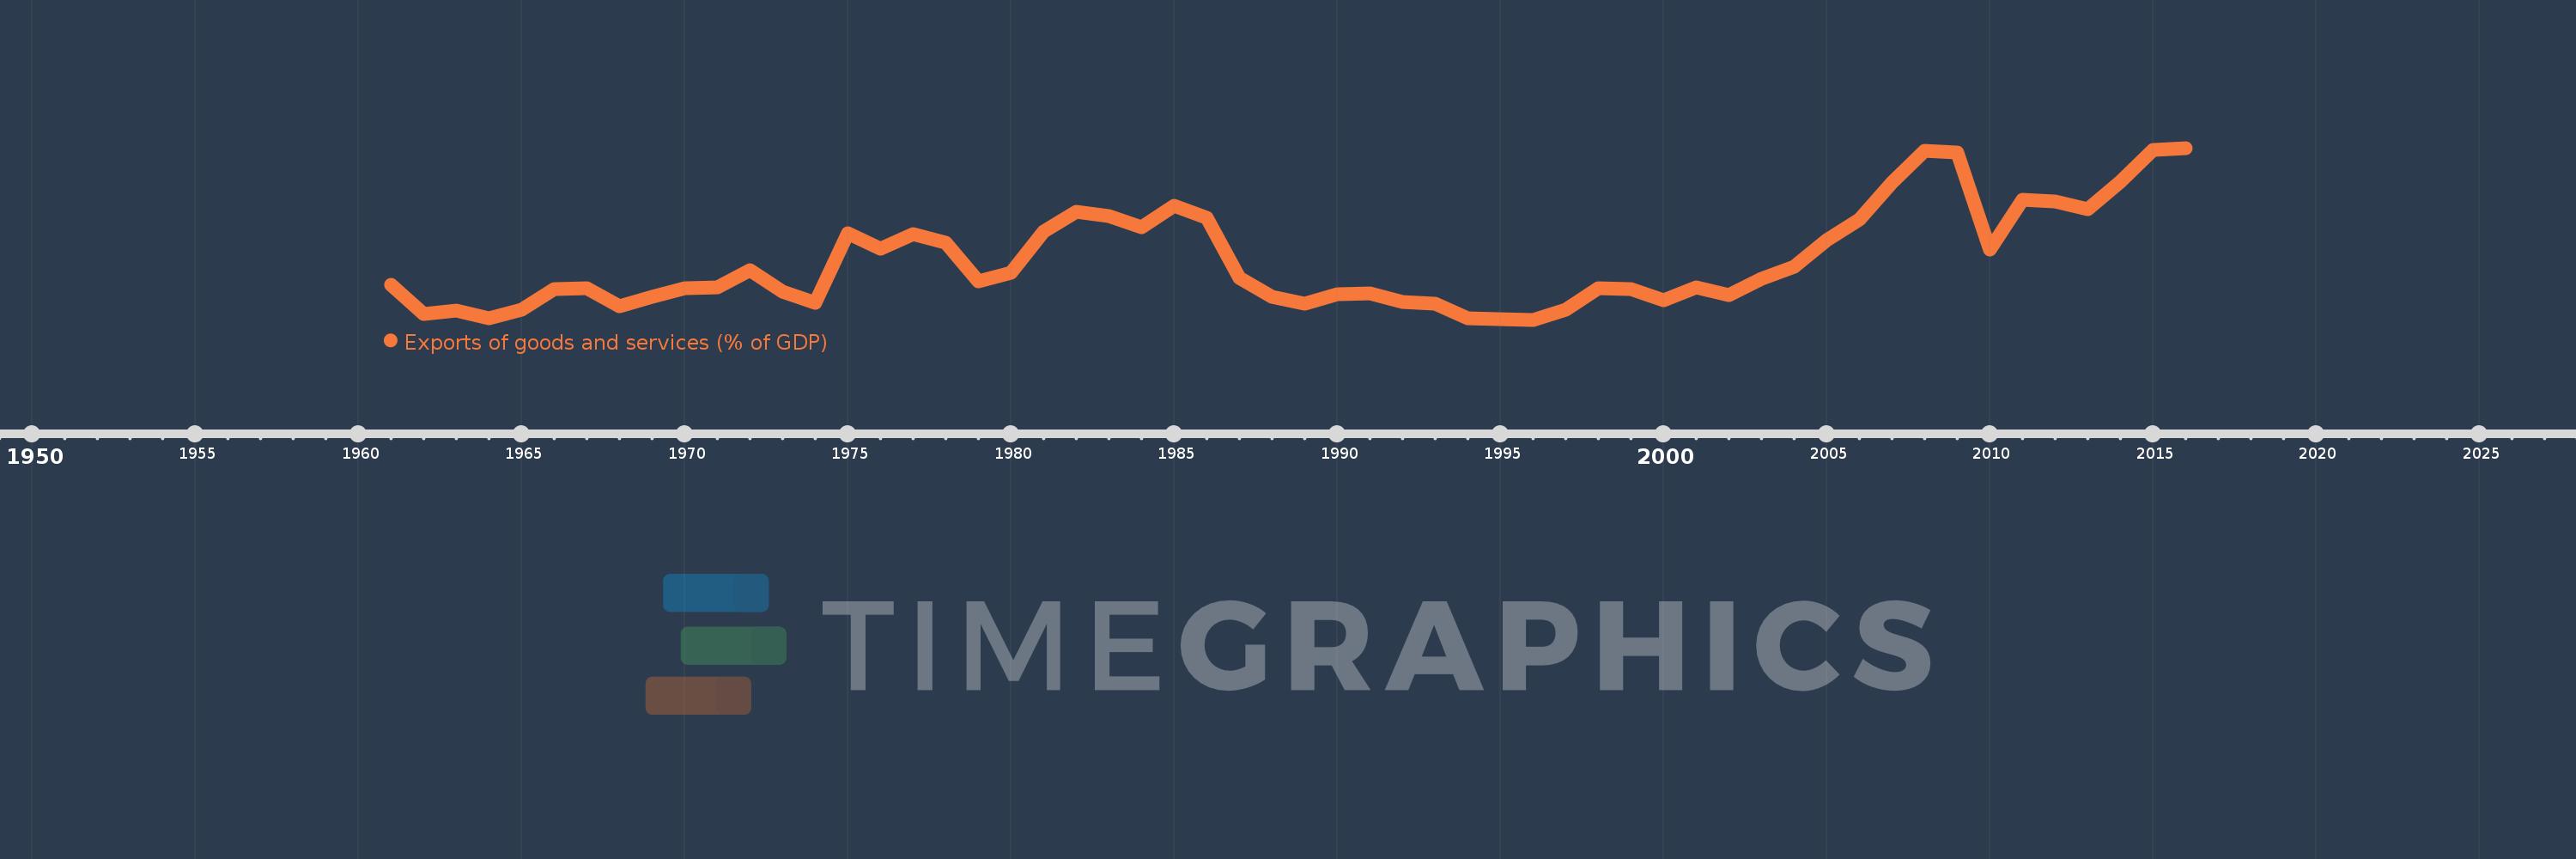
Exports of goods and services (% of GDP)
2016,2015,2014,2013,2012,2011,2010,2009,2008,2007,2006,2005,2004,2003,2002,2001,2000,1999,1998,1997,1996,1995,1994,1993,1992,1991,1990,1989,1988,1987,1986,1985,1984,1983,1982,1981,1980,1979,1978,1977,1976,1975,1974,1973,1972,1971,1970,1969,1968,1967,1966,1965,1964,1963,1962,1961
This statistics in other country:
AfghanistanAlbaniaAlgeriaAngolaAntigua and BarbudaArab WorldArgentinaArmeniaArubaAustraliaAustriaAzerbaijanBahamas, TheBahrainBangladeshBarbadosBelarusBelgiumBelizeBeninBermudaBhutanBoliviaBosnia and HerzegovinaBotswanaBrazilBrunei DarussalamBulgariaBurkina FasoBurundiCabo VerdeCambodiaCameroonCanadaCaribbean small statesCentral African RepublicCentral Europe and the BalticsChadChileChinaColombiaComorosCongo, Dem. Rep.Congo, Rep.Costa RicaCote d'IvoireCroatiaCubaCyprusCzech RepublicDenmarkDjiboutiDominicaDominican RepublicEarly-demographic dividendEast Asia & PacificEast Asia & Pacific (excluding high income)East Asia & Pacific (IDA & IBRD countries)EcuadorEgypt, Arab Rep.El SalvadorEquatorial GuineaEritreaEstoniaEthiopiaEuro areaEurope & Central AsiaEurope & Central Asia (excluding high income)Europe & Central Asia (IDA & IBRD countries)European UnionFaroe IslandsFijiFinlandFragile and conflict affected situationsFranceFrench PolynesiaGabonGambia, TheGeorgiaGermanyGhanaGreeceGrenadaGuatemalaGuineaGuinea-BissauGuyanaHaitiHeavily indebted poor countries (HIPC)High incomeHondurasHong Kong SAR, ChinaHungaryIBRD onlyIcelandIDA & IBRD totalIDA blendIDA onlyIDA totalIndiaIndonesiaIran, Islamic Rep.IraqIrelandIsraelItalyJamaicaJapanJordanKazakhstanKenyaKiribatiKorea, Rep.KosovoKuwaitKyrgyz RepublicLao PDRLate-demographic dividendLatin America & Caribbean Latin America & Caribbean (excluding high income)Latin America & the Caribbean (IDA & IBRD countries)LatviaLeast developed countries: UN classificationLebanonLesothoLiberiaLibyaLithuaniaLow & middle incomeLow incomeLower middle incomeLuxembourgMacao SAR, ChinaMacedonia, FYRMadagascarMalawiMalaysiaMaldivesMaliMaltaMauritaniaMauritiusMexicoMicronesia, Fed. Sts.Middle East & North AfricaMiddle East & North Africa (excluding high income)Middle East & North Africa (IDA & IBRD countries)Middle incomeMoldovaMongoliaMontenegroMoroccoMozambiqueMyanmarNamibiaNepalNetherlandsNew CaledoniaNew ZealandNicaraguaNigerNigeriaNorth AmericaNorwayOECD membersOmanOther small statesPacific island small statesPakistanPalauPanamaPapua New GuineaParaguayPeruPhilippinesPolandPortugalPost-demographic dividendPre-demographic dividendPuerto RicoQatarRomaniaRussian FederationRwandaSamoaSaudi ArabiaSenegalSerbiaSeychellesSierra LeoneSingaporeSlovak RepublicSloveniaSmall statesSolomon IslandsSomaliaSouth AfricaSouth AsiaSouth Asia (IDA & IBRD)South SudanSpainSri LankaSt. Kitts and NevisSt. LuciaSt. Vincent and the GrenadinesSub-Saharan Africa Sub-Saharan Africa (excluding high income)Sub-Saharan Africa (IDA & IBRD countries)SudanSurinameSwazilandSwedenSwitzerlandSyrian Arab RepublicTajikistanTanzaniaThailandTimor-LesteTogoTongaTrinidad and TobagoTunisiaTurkeyTurkmenistanUgandaUkraineUnited Arab EmiratesUnited KingdomUnited StatesUpper middle incomeUruguayUzbekistanVanuatuVenezuela, RBVietnamWest Bank and GazaWorldYemen, Rep.ZambiaZimbabwe Timeline:
This timeline shows a graph from 1961 to 2016 of Japan. No data until 1960. Number of actual observations by date: 56.
Source name:
World Development Indicators
Source organization:
World Bank national accounts data, and OECD National Accounts data files.
Categories, topics:
Economy & Growth, Trade
Last updated:
apr 23, 2017
Indicators value changes by year
Maximum:
17.636
jan 1, 2016
At the date of observation
Value
Absolute change
Change from previous value
jan 1, 1961
10.723
+10.723
0.0%
jan 1, 1962
9.278
-1.445
-13.48%
jan 1, 1963
9.431
+0.153
1.65%
jan 1, 1964
9.038
-0.393
-4.17%
jan 1, 1965
9.494
+0.456
5.05%
jan 1, 1966
10.518
+1.024
10.78%
jan 1, 1967
10.578
+0.061
0.58%
jan 1, 1968
9.654
-0.924
-8.74%
jan 1, 1969
10.112
+0.458
4.74%
jan 1, 1970
10.556
+0.444
4.39%
jan 1, 1971
10.593
+0.037
0.35%
jan 1, 1972
11.482
+0.888
8.39%
jan 1, 1973
10.376
-1.106
-9.64%
jan 1, 1974
9.839
-0.537
-5.17%
jan 1, 1975
13.332
+3.493
35.5%
jan 1, 1976
12.545
-0.787
-5.9%
jan 1, 1977
13.289
+0.745
5.94%
jan 1, 1978
12.837
-0.452
-3.4%
jan 1, 1979
10.9
-1.937
-15.09%
jan 1, 1980
11.339
+0.439
4.03%
jan 1, 1981
13.423
+2.083
18.37%
jan 1, 1982
14.399
+0.976
7.27%
jan 1, 1983
14.202
-0.197
-1.37%
jan 1, 1984
13.633
-0.569
-4.01%
jan 1, 1985
14.72
+1.087
7.98%
jan 1, 1986
14.095
-0.625
-4.25%
jan 1, 1987
11.1
-2.995
-21.25%
jan 1, 1988
10.147
-0.953
-8.59%
jan 1, 1989
9.765
-0.382
-3.76%
jan 1, 1990
10.238
+0.473
4.85%
jan 1, 1991
10.288
+0.05
0.49%
jan 1, 1992
9.874
-0.414
-4.02%
jan 1, 1993
9.769
-0.105
-1.07%
jan 1, 1994
9.057
-0.712
-7.29%
jan 1, 1995
9.004
-0.054
-0.59%
jan 1, 1996
8.972
-0.032
-0.35%
jan 1, 1997
9.479
+0.507
5.65%
jan 1, 1998
10.549
+1.07
11.29%
jan 1, 1999
10.524
-0.024
-0.23%
jan 1, 2000
9.952
-0.573
-5.44%
jan 1, 2001
10.624
+0.673
6.76%
jan 1, 2002
10.229
-0.395
-3.72%
jan 1, 2003
11.018
+0.789
7.71%
jan 1, 2004
11.639
+0.621
5.64%
jan 1, 2005
12.972
+1.333
11.45%
jan 1, 2006
14.012
+1.04
8.02%
jan 1, 2007
15.873
+1.86
13.28%
jan 1, 2008
17.493
+1.62
10.21%
jan 1, 2009
17.424
-0.069
-0.4%
jan 1, 2010
12.521
-4.903
-28.14%
jan 1, 2011
15.037
+2.516
20.09%
jan 1, 2012
14.925
-0.112
-0.74%
jan 1, 2013
14.545
-0.38
-2.55%
jan 1, 2014
15.915
+1.371
9.42%
jan 1, 2015
17.546
+1.631
10.25%
jan 1, 2016
17.636
+0.089
0.51%
Ranking of countries by current statistics by years


Comments: