29
/
en
AIzaSyAYiBZKx7MnpbEhh9jyipgxe19OcubqV5w
April 1, 2024
210293
Nicaragua
NIC
true
2
1
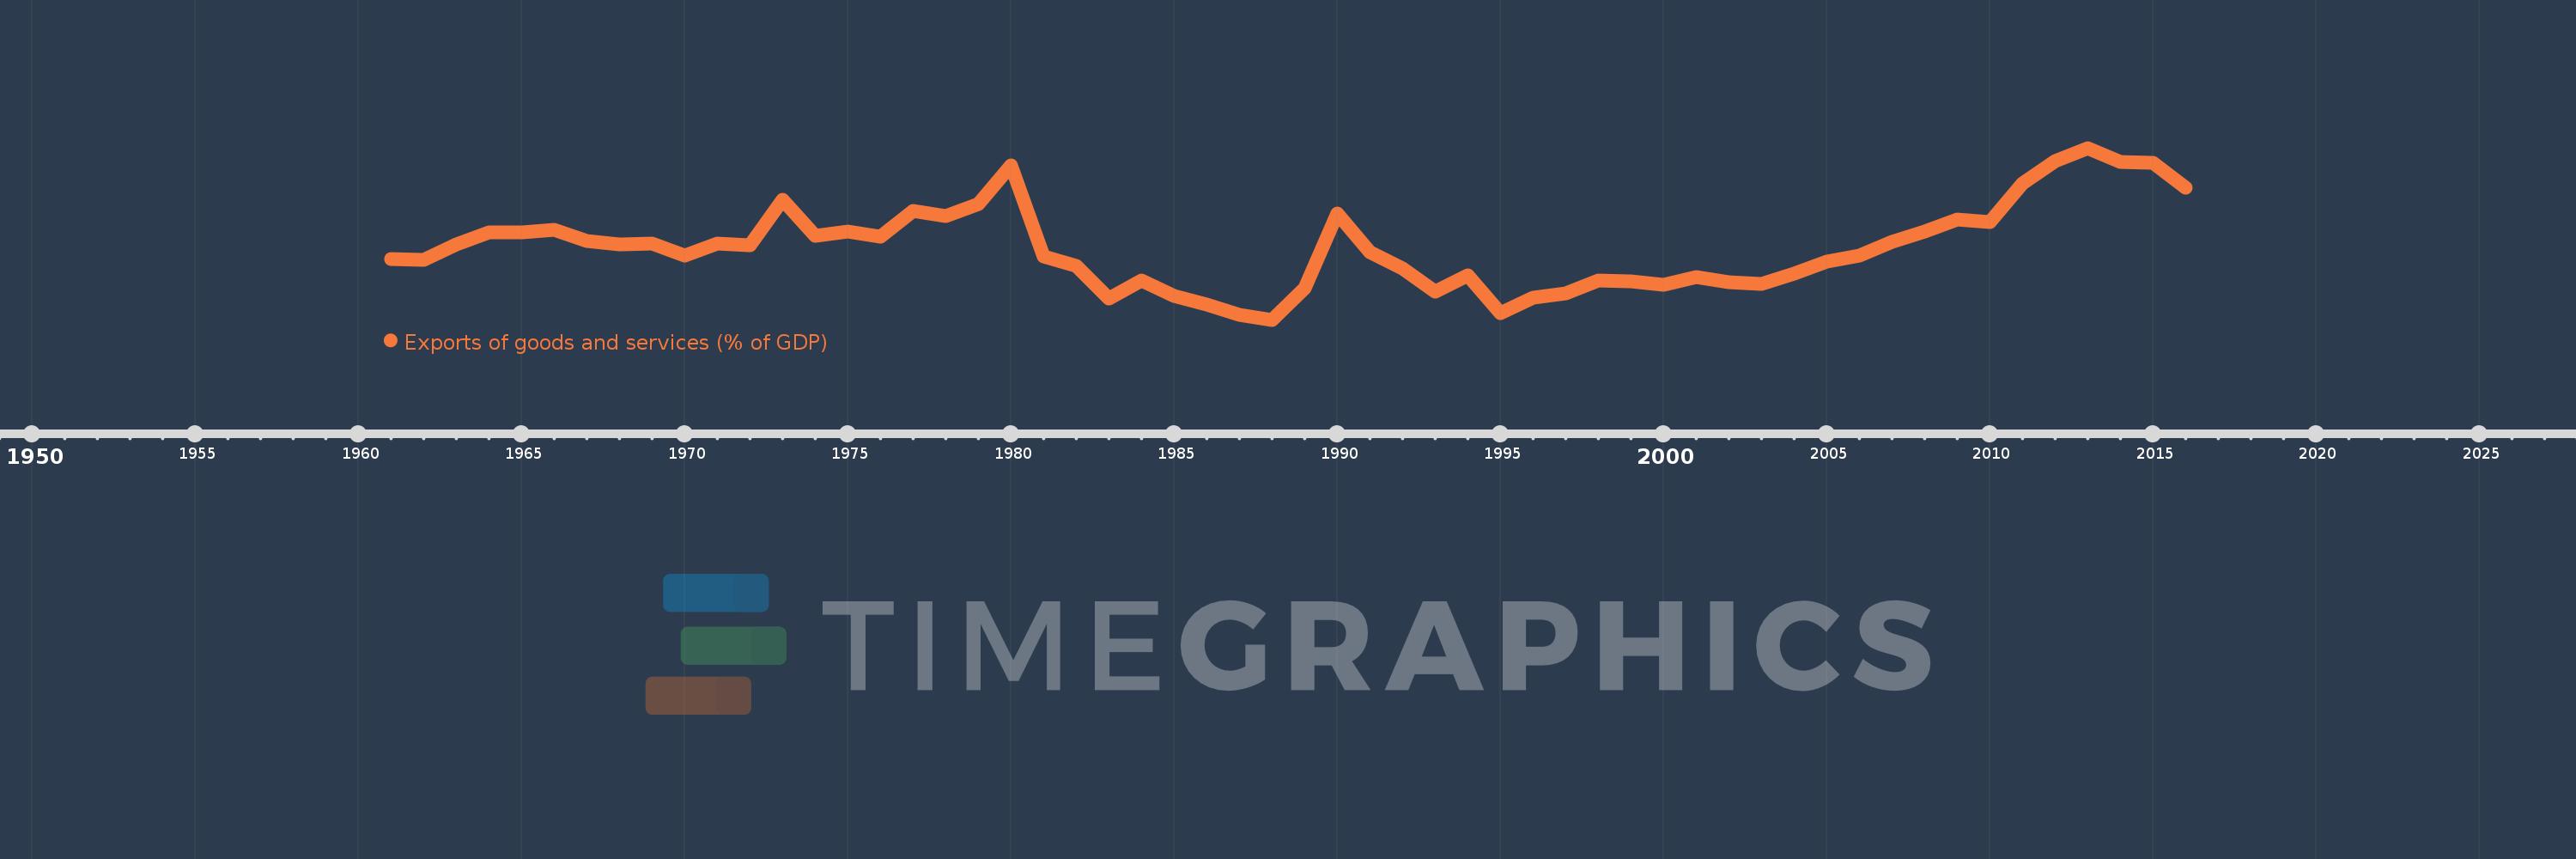
Exports of goods and services (% of GDP)
2016,2015,2014,2013,2012,2011,2010,2009,2008,2007,2006,2005,2004,2003,2002,2001,2000,1999,1998,1997,1996,1995,1994,1993,1992,1991,1990,1989,1988,1987,1986,1985,1984,1983,1982,1981,1980,1979,1978,1977,1976,1975,1974,1973,1972,1971,1970,1969,1968,1967,1966,1965,1964,1963,1962,1961
This statistics in other country:
AfghanistanAlbaniaAlgeriaAngolaAntigua and BarbudaArab WorldArgentinaArmeniaArubaAustraliaAustriaAzerbaijanBahamas, TheBahrainBangladeshBarbadosBelarusBelgiumBelizeBeninBermudaBhutanBoliviaBosnia and HerzegovinaBotswanaBrazilBrunei DarussalamBulgariaBurkina FasoBurundiCabo VerdeCambodiaCameroonCanadaCaribbean small statesCentral African RepublicCentral Europe and the BalticsChadChileChinaColombiaComorosCongo, Dem. Rep.Congo, Rep.Costa RicaCote d'IvoireCroatiaCubaCyprusCzech RepublicDenmarkDjiboutiDominicaDominican RepublicEarly-demographic dividendEast Asia & PacificEast Asia & Pacific (excluding high income)East Asia & Pacific (IDA & IBRD countries)EcuadorEgypt, Arab Rep.El SalvadorEquatorial GuineaEritreaEstoniaEthiopiaEuro areaEurope & Central AsiaEurope & Central Asia (excluding high income)Europe & Central Asia (IDA & IBRD countries)European UnionFaroe IslandsFijiFinlandFragile and conflict affected situationsFranceFrench PolynesiaGabonGambia, TheGeorgiaGermanyGhanaGreeceGrenadaGuatemalaGuineaGuinea-BissauGuyanaHaitiHeavily indebted poor countries (HIPC)High incomeHondurasHong Kong SAR, ChinaHungaryIBRD onlyIcelandIDA & IBRD totalIDA blendIDA onlyIDA totalIndiaIndonesiaIran, Islamic Rep.IraqIrelandIsraelItalyJamaicaJapanJordanKazakhstanKenyaKiribatiKorea, Rep.KosovoKuwaitKyrgyz RepublicLao PDRLate-demographic dividendLatin America & Caribbean Latin America & Caribbean (excluding high income)Latin America & the Caribbean (IDA & IBRD countries)LatviaLeast developed countries: UN classificationLebanonLesothoLiberiaLibyaLithuaniaLow & middle incomeLow incomeLower middle incomeLuxembourgMacao SAR, ChinaMacedonia, FYRMadagascarMalawiMalaysiaMaldivesMaliMaltaMauritaniaMauritiusMexicoMicronesia, Fed. Sts.Middle East & North AfricaMiddle East & North Africa (excluding high income)Middle East & North Africa (IDA & IBRD countries)Middle incomeMoldovaMongoliaMontenegroMoroccoMozambiqueMyanmarNamibiaNepalNetherlandsNew CaledoniaNew ZealandNicaraguaNigerNigeriaNorth AmericaNorwayOECD membersOmanOther small statesPacific island small statesPakistanPalauPanamaPapua New GuineaParaguayPeruPhilippinesPolandPortugalPost-demographic dividendPre-demographic dividendPuerto RicoQatarRomaniaRussian FederationRwandaSamoaSaudi ArabiaSenegalSerbiaSeychellesSierra LeoneSingaporeSlovak RepublicSloveniaSmall statesSolomon IslandsSomaliaSouth AfricaSouth AsiaSouth Asia (IDA & IBRD)South SudanSpainSri LankaSt. Kitts and NevisSt. LuciaSt. Vincent and the GrenadinesSub-Saharan Africa Sub-Saharan Africa (excluding high income)Sub-Saharan Africa (IDA & IBRD countries)SudanSurinameSwazilandSwedenSwitzerlandSyrian Arab RepublicTajikistanTanzaniaThailandTimor-LesteTogoTongaTrinidad and TobagoTunisiaTurkeyTurkmenistanUgandaUkraineUnited Arab EmiratesUnited KingdomUnited StatesUpper middle incomeUruguayUzbekistanVanuatuVenezuela, RBVietnamWest Bank and GazaWorldYemen, Rep.ZambiaZimbabwe Timeline:
This timeline shows a graph from 1961 to 2016 of Nicaragua. No data until 1960. Number of actual observations by date: 56.
Source name:
World Development Indicators
Source organization:
World Bank national accounts data, and OECD National Accounts data files.
Categories, topics:
Economy & Growth, Trade
Last updated:
apr 23, 2017
Indicators value changes by year
Minimum:
11.771
jan 1, 1988
Maximum:
45.355
jan 1, 2013
At the date of observation
Value
Absolute change
Change from previous value
jan 1, 1961
23.653
+23.653
0.0%
jan 1, 1962
23.402
-0.251
-1.06%
jan 1, 1963
26.432
+3.03
12.95%
jan 1, 1964
28.824
+2.393
9.05%
jan 1, 1965
28.874
+0.05
0.17%
jan 1, 1966
29.301
+0.427
1.48%
jan 1, 1967
27.115
-2.185
-7.46%
jan 1, 1968
26.462
-0.653
-2.41%
jan 1, 1969
26.685
+0.223
0.84%
jan 1, 1970
24.386
-2.299
-8.62%
jan 1, 1971
26.732
+2.346
9.62%
jan 1, 1972
26.3
-0.433
-1.62%
jan 1, 1973
35.289
+8.99
34.18%
jan 1, 1974
28.21
-7.079
-20.06%
jan 1, 1975
29.075
+0.865
3.06%
jan 1, 1976
28.043
-1.032
-3.55%
jan 1, 1977
32.995
+4.952
17.66%
jan 1, 1978
32.091
-0.903
-2.74%
jan 1, 1979
34.41
+2.318
7.22%
jan 1, 1980
42.025
+7.615
22.13%
jan 1, 1981
24.229
-17.796
-42.35%
jan 1, 1982
22.344
-1.885
-7.78%
jan 1, 1983
15.979
-6.365
-28.49%
jan 1, 1984
19.4
+3.421
21.41%
jan 1, 1985
16.443
-2.957
-15.24%
jan 1, 1986
14.766
-1.677
-10.2%
jan 1, 1987
12.776
-1.99
-13.48%
jan 1, 1988
11.771
-1.006
-7.87%
jan 1, 1989
17.981
+6.21
52.76%
jan 1, 1990
32.537
+14.556
80.95%
jan 1, 1991
24.948
-7.589
-23.32%
jan 1, 1992
21.822
-3.126
-12.53%
jan 1, 1993
17.251
-4.571
-20.95%
jan 1, 1994
20.428
+3.177
18.41%
jan 1, 1995
13.14
-7.288
-35.68%
jan 1, 1996
16.095
+2.955
22.49%
jan 1, 1997
16.847
+0.752
4.67%
jan 1, 1998
19.42
+2.572
15.27%
jan 1, 1999
19.334
-0.085
-0.44%
jan 1, 2000
18.53
-0.804
-4.16%
jan 1, 2001
20.108
+1.578
8.52%
jan 1, 2002
19.042
-1.066
-5.3%
jan 1, 2003
18.847
-0.195
-1.02%
jan 1, 2004
20.705
+1.858
9.86%
jan 1, 2005
23.06
+2.355
11.37%
jan 1, 2006
24.382
+1.322
5.73%
jan 1, 2007
27.039
+2.657
10.9%
jan 1, 2008
29.019
+1.98
7.32%
jan 1, 2009
31.33
+2.311
7.96%
jan 1, 2010
30.894
-0.436
-1.39%
jan 1, 2011
38.449
+7.555
24.45%
jan 1, 2012
42.721
+4.272
11.11%
jan 1, 2013
45.355
+2.634
6.16%
jan 1, 2014
42.682
-2.673
-5.89%
jan 1, 2015
42.386
-0.295
-0.69%
jan 1, 2016
37.521
-4.866
-11.48%
Ranking of countries by current statistics by years


Comments: