29
/
en
AIzaSyAYiBZKx7MnpbEhh9jyipgxe19OcubqV5w
April 1, 2024
116833
Cyprus
CYP
true
2
1
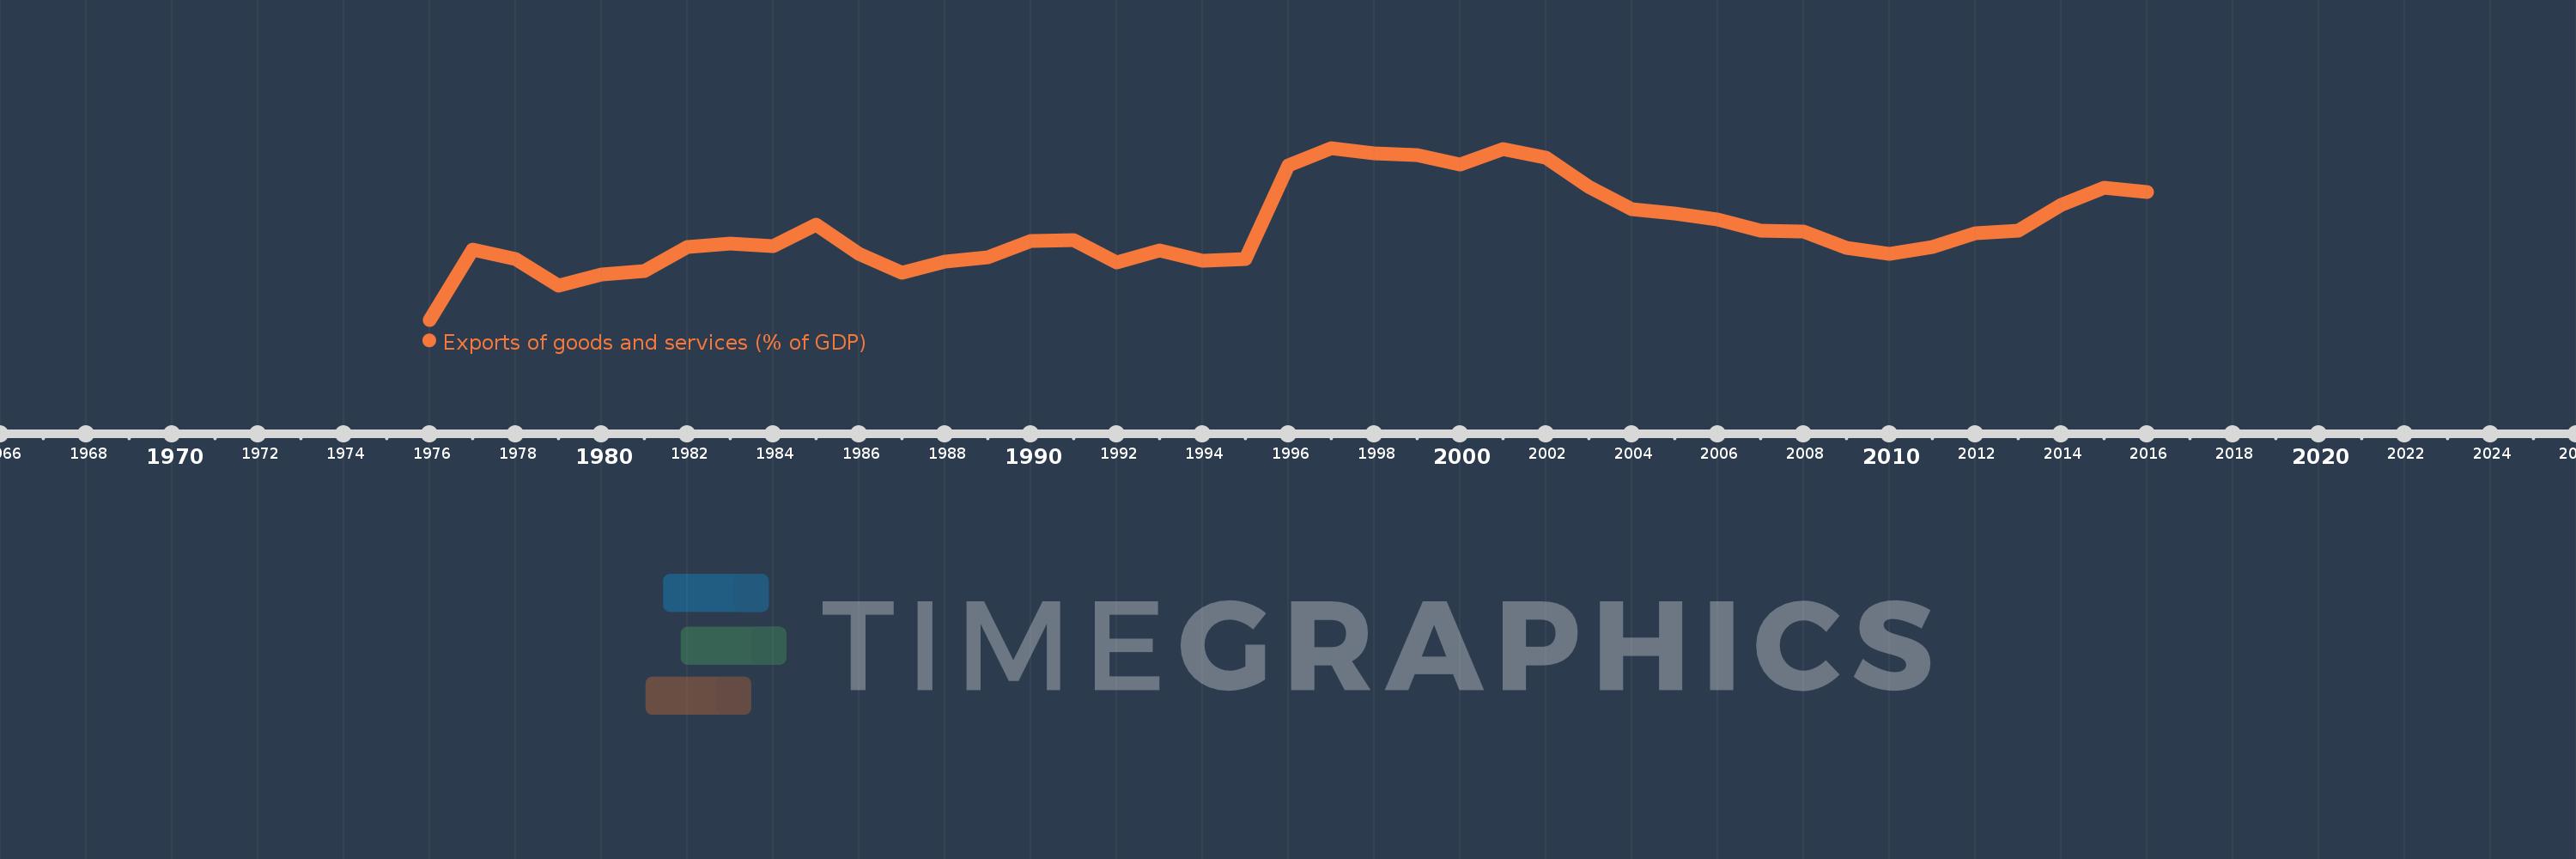
Exports of goods and services (% of GDP)
2016,2015,2014,2013,2012,2011,2010,2009,2008,2007,2006,2005,2004,2003,2002,2001,2000,1999,1998,1997,1996,1995,1994,1993,1992,1991,1990,1989,1988,1987,1986,1985,1984,1983,1982,1981,1980,1979,1978,1977,1976
This statistics in other country:
AfghanistanAlbaniaAlgeriaAngolaAntigua and BarbudaArab WorldArgentinaArmeniaArubaAustraliaAustriaAzerbaijanBahamas, TheBahrainBangladeshBarbadosBelarusBelgiumBelizeBeninBermudaBhutanBoliviaBosnia and HerzegovinaBotswanaBrazilBrunei DarussalamBulgariaBurkina FasoBurundiCabo VerdeCambodiaCameroonCanadaCaribbean small statesCentral African RepublicCentral Europe and the BalticsChadChileChinaColombiaComorosCongo, Dem. Rep.Congo, Rep.Costa RicaCote d'IvoireCroatiaCubaCyprusCzech RepublicDenmarkDjiboutiDominicaDominican RepublicEarly-demographic dividendEast Asia & PacificEast Asia & Pacific (excluding high income)East Asia & Pacific (IDA & IBRD countries)EcuadorEgypt, Arab Rep.El SalvadorEquatorial GuineaEritreaEstoniaEthiopiaEuro areaEurope & Central AsiaEurope & Central Asia (excluding high income)Europe & Central Asia (IDA & IBRD countries)European UnionFaroe IslandsFijiFinlandFragile and conflict affected situationsFranceFrench PolynesiaGabonGambia, TheGeorgiaGermanyGhanaGreeceGrenadaGuatemalaGuineaGuinea-BissauGuyanaHaitiHeavily indebted poor countries (HIPC)High incomeHondurasHong Kong SAR, ChinaHungaryIBRD onlyIcelandIDA & IBRD totalIDA blendIDA onlyIDA totalIndiaIndonesiaIran, Islamic Rep.IraqIrelandIsraelItalyJamaicaJapanJordanKazakhstanKenyaKiribatiKorea, Rep.KosovoKuwaitKyrgyz RepublicLao PDRLate-demographic dividendLatin America & Caribbean Latin America & Caribbean (excluding high income)Latin America & the Caribbean (IDA & IBRD countries)LatviaLeast developed countries: UN classificationLebanonLesothoLiberiaLibyaLithuaniaLow & middle incomeLow incomeLower middle incomeLuxembourgMacao SAR, ChinaMacedonia, FYRMadagascarMalawiMalaysiaMaldivesMaliMaltaMauritaniaMauritiusMexicoMicronesia, Fed. Sts.Middle East & North AfricaMiddle East & North Africa (excluding high income)Middle East & North Africa (IDA & IBRD countries)Middle incomeMoldovaMongoliaMontenegroMoroccoMozambiqueMyanmarNamibiaNepalNetherlandsNew CaledoniaNew ZealandNicaraguaNigerNigeriaNorth AmericaNorwayOECD membersOmanOther small statesPacific island small statesPakistanPalauPanamaPapua New GuineaParaguayPeruPhilippinesPolandPortugalPost-demographic dividendPre-demographic dividendPuerto RicoQatarRomaniaRussian FederationRwandaSamoaSaudi ArabiaSenegalSerbiaSeychellesSierra LeoneSingaporeSlovak RepublicSloveniaSmall statesSolomon IslandsSomaliaSouth AfricaSouth AsiaSouth Asia (IDA & IBRD)South SudanSpainSri LankaSt. Kitts and NevisSt. LuciaSt. Vincent and the GrenadinesSub-Saharan Africa Sub-Saharan Africa (excluding high income)Sub-Saharan Africa (IDA & IBRD countries)SudanSurinameSwazilandSwedenSwitzerlandSyrian Arab RepublicTajikistanTanzaniaThailandTimor-LesteTogoTongaTrinidad and TobagoTunisiaTurkeyTurkmenistanUgandaUkraineUnited Arab EmiratesUnited KingdomUnited StatesUpper middle incomeUruguayUzbekistanVanuatuVenezuela, RBVietnamWest Bank and GazaWorldYemen, Rep.ZambiaZimbabwe Timeline:
This timeline shows a graph from 1976 to 2016 of Cyprus. No data until 1975. Number of actual observations by date: 41.
Source name:
World Development Indicators
Source organization:
World Bank national accounts data, and OECD National Accounts data files.
Categories, topics:
Economy & Growth, Trade
Last updated:
apr 23, 2017
Indicators value changes by year
Minimum:
35.486
jan 1, 1976
Maximum:
70.209
jan 1, 1997
At the date of observation
Value
Absolute change
Change from previous value
jan 1, 1976
35.486
+35.486
0.0%
jan 1, 1977
49.745
+14.259
40.18%
jan 1, 1978
47.814
-1.932
-3.88%
jan 1, 1979
42.33
-5.484
-11.47%
jan 1, 1980
44.681
+2.351
5.55%
jan 1, 1981
45.258
+0.578
1.29%
jan 1, 1982
50.251
+4.993
11.03%
jan 1, 1983
50.922
+0.671
1.34%
jan 1, 1984
50.409
-0.513
-1.01%
jan 1, 1985
54.658
+4.249
8.43%
jan 1, 1986
48.738
-5.92
-10.83%
jan 1, 1987
45.037
-3.701
-7.59%
jan 1, 1988
47.287
+2.25
5.0%
jan 1, 1989
48.079
+0.792
1.67%
jan 1, 1990
51.46
+3.381
7.03%
jan 1, 1991
51.501
+0.041
0.08%
jan 1, 1992
47.086
-4.415
-8.57%
jan 1, 1993
49.457
+2.371
5.04%
jan 1, 1994
47.491
-1.966
-3.97%
jan 1, 1995
47.689
+0.198
0.42%
jan 1, 1996
66.762
+19.072
39.99%
jan 1, 1997
70.209
+3.447
5.16%
jan 1, 1998
69.187
-1.023
-1.46%
jan 1, 1999
68.698
-0.488
-0.71%
jan 1, 2000
66.928
-1.771
-2.58%
jan 1, 2001
69.963
+3.036
4.54%
jan 1, 2002
68.209
-1.755
-2.51%
jan 1, 2003
62.405
-5.804
-8.51%
jan 1, 2004
57.762
-4.643
-7.44%
jan 1, 2005
56.89
-0.872
-1.51%
jan 1, 2006
55.692
-1.198
-2.11%
jan 1, 2007
53.436
-2.257
-4.05%
jan 1, 2008
53.259
-0.177
-0.33%
jan 1, 2009
50.091
-3.168
-5.95%
jan 1, 2010
48.727
-1.364
-2.72%
jan 1, 2011
50.213
+1.485
3.05%
jan 1, 2012
52.928
+2.715
5.41%
jan 1, 2013
53.506
+0.579
1.09%
jan 1, 2014
58.721
+5.214
9.74%
jan 1, 2015
62.192
+3.472
5.91%
jan 1, 2016
61.218
-0.975
-1.57%
Ranking of countries by current statistics by years


Comments: