29
/
en
AIzaSyAYiBZKx7MnpbEhh9jyipgxe19OcubqV5w
April 1, 2024
252953
Sudan
SDN
true
2
1
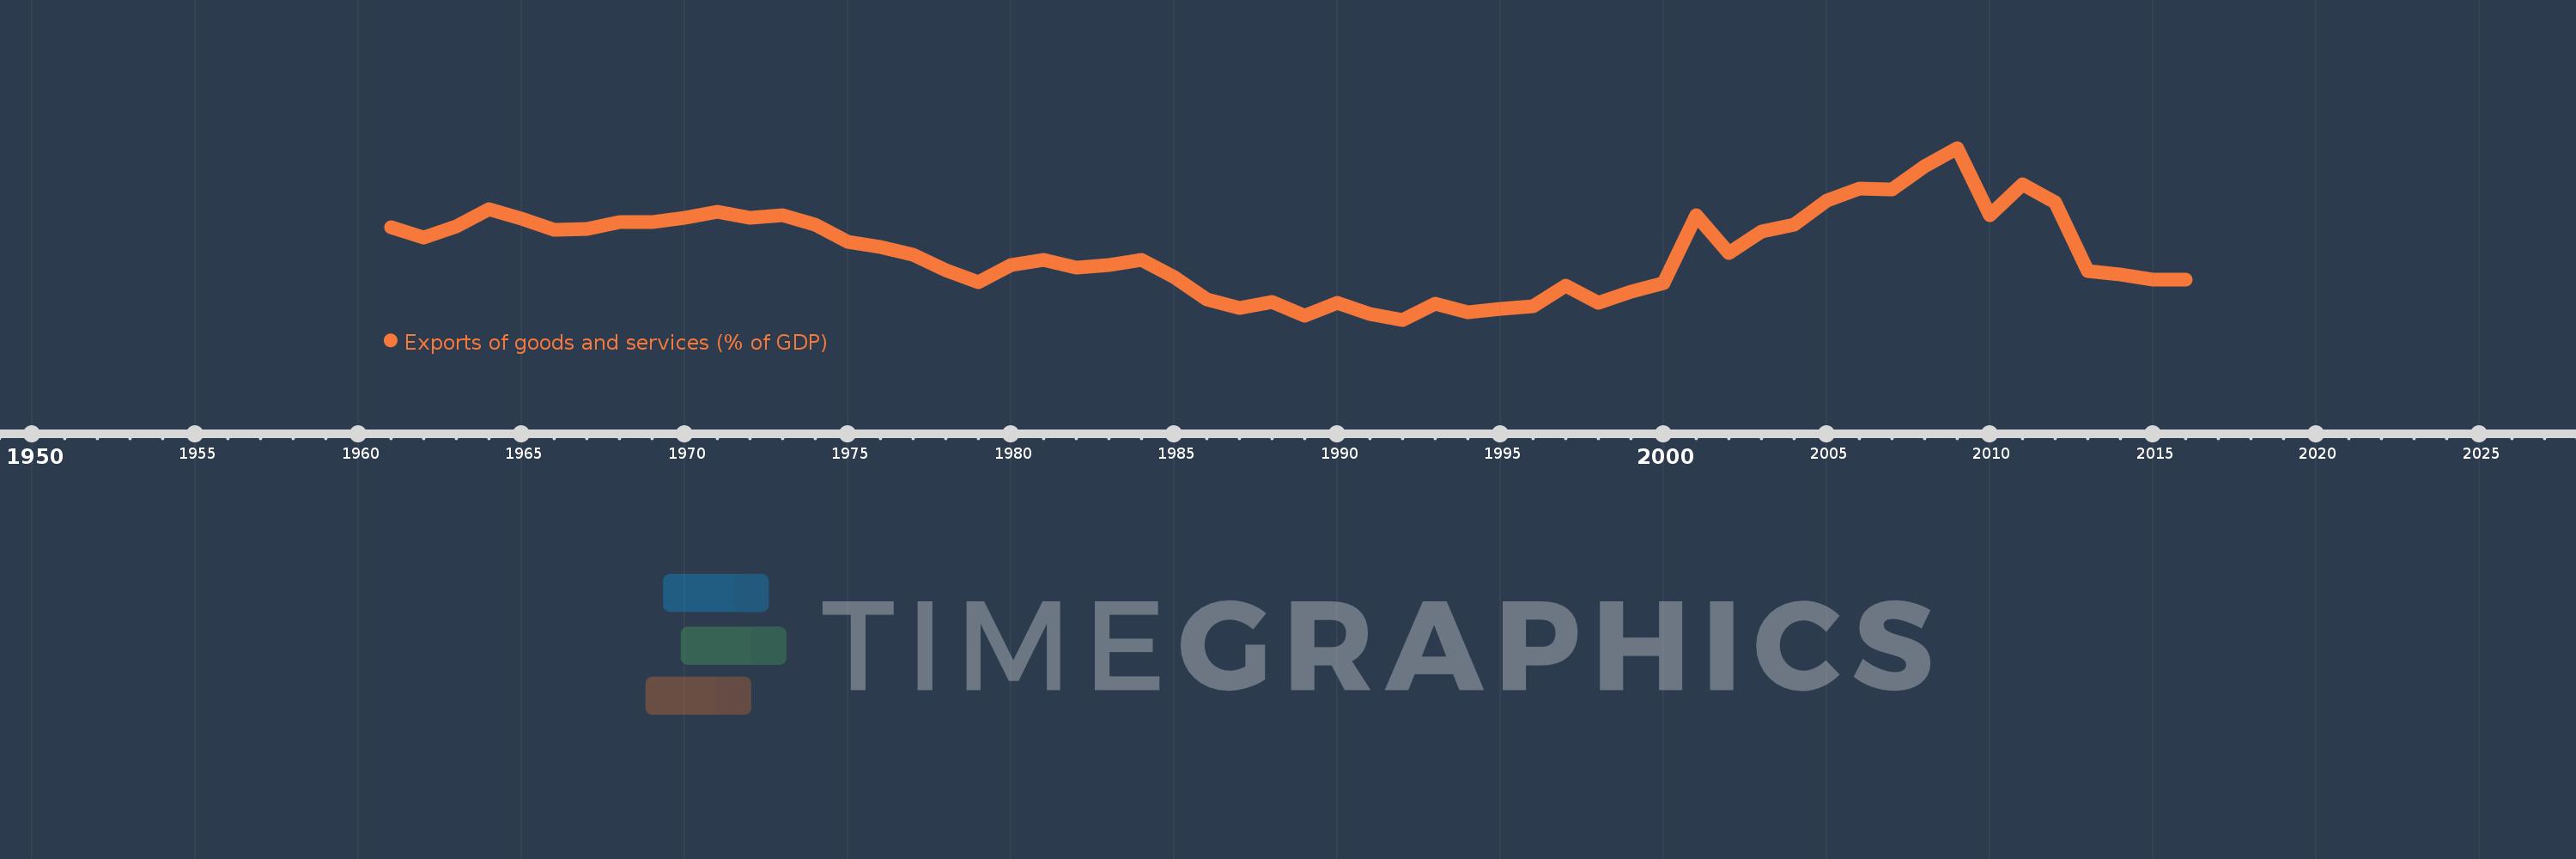
Exports of goods and services (% of GDP)
2016,2015,2014,2013,2012,2011,2010,2009,2008,2007,2006,2005,2004,2003,2002,2001,2000,1999,1998,1997,1996,1995,1994,1993,1992,1991,1990,1989,1988,1987,1986,1985,1984,1983,1982,1981,1980,1979,1978,1977,1976,1975,1974,1973,1972,1971,1970,1969,1968,1967,1966,1965,1964,1963,1962,1961
This statistics in other country:
AfghanistanAlbaniaAlgeriaAngolaAntigua and BarbudaArab WorldArgentinaArmeniaArubaAustraliaAustriaAzerbaijanBahamas, TheBahrainBangladeshBarbadosBelarusBelgiumBelizeBeninBermudaBhutanBoliviaBosnia and HerzegovinaBotswanaBrazilBrunei DarussalamBulgariaBurkina FasoBurundiCabo VerdeCambodiaCameroonCanadaCaribbean small statesCentral African RepublicCentral Europe and the BalticsChadChileChinaColombiaComorosCongo, Dem. Rep.Congo, Rep.Costa RicaCote d'IvoireCroatiaCubaCyprusCzech RepublicDenmarkDjiboutiDominicaDominican RepublicEarly-demographic dividendEast Asia & PacificEast Asia & Pacific (excluding high income)East Asia & Pacific (IDA & IBRD countries)EcuadorEgypt, Arab Rep.El SalvadorEquatorial GuineaEritreaEstoniaEthiopiaEuro areaEurope & Central AsiaEurope & Central Asia (excluding high income)Europe & Central Asia (IDA & IBRD countries)European UnionFaroe IslandsFijiFinlandFragile and conflict affected situationsFranceFrench PolynesiaGabonGambia, TheGeorgiaGermanyGhanaGreeceGrenadaGuatemalaGuineaGuinea-BissauGuyanaHaitiHeavily indebted poor countries (HIPC)High incomeHondurasHong Kong SAR, ChinaHungaryIBRD onlyIcelandIDA & IBRD totalIDA blendIDA onlyIDA totalIndiaIndonesiaIran, Islamic Rep.IraqIrelandIsraelItalyJamaicaJapanJordanKazakhstanKenyaKiribatiKorea, Rep.KosovoKuwaitKyrgyz RepublicLao PDRLate-demographic dividendLatin America & Caribbean Latin America & Caribbean (excluding high income)Latin America & the Caribbean (IDA & IBRD countries)LatviaLeast developed countries: UN classificationLebanonLesothoLiberiaLibyaLithuaniaLow & middle incomeLow incomeLower middle incomeLuxembourgMacao SAR, ChinaMacedonia, FYRMadagascarMalawiMalaysiaMaldivesMaliMaltaMauritaniaMauritiusMexicoMicronesia, Fed. Sts.Middle East & North AfricaMiddle East & North Africa (excluding high income)Middle East & North Africa (IDA & IBRD countries)Middle incomeMoldovaMongoliaMontenegroMoroccoMozambiqueMyanmarNamibiaNepalNetherlandsNew CaledoniaNew ZealandNicaraguaNigerNigeriaNorth AmericaNorwayOECD membersOmanOther small statesPacific island small statesPakistanPalauPanamaPapua New GuineaParaguayPeruPhilippinesPolandPortugalPost-demographic dividendPre-demographic dividendPuerto RicoQatarRomaniaRussian FederationRwandaSamoaSaudi ArabiaSenegalSerbiaSeychellesSierra LeoneSingaporeSlovak RepublicSloveniaSmall statesSolomon IslandsSomaliaSouth AfricaSouth AsiaSouth Asia (IDA & IBRD)South SudanSpainSri LankaSt. Kitts and NevisSt. LuciaSt. Vincent and the GrenadinesSub-Saharan Africa Sub-Saharan Africa (excluding high income)Sub-Saharan Africa (IDA & IBRD countries)SudanSurinameSwazilandSwedenSwitzerlandSyrian Arab RepublicTajikistanTanzaniaThailandTimor-LesteTogoTongaTrinidad and TobagoTunisiaTurkeyTurkmenistanUgandaUkraineUnited Arab EmiratesUnited KingdomUnited StatesUpper middle incomeUruguayUzbekistanVanuatuVenezuela, RBVietnamWest Bank and GazaWorldYemen, Rep.ZambiaZimbabwe Timeline:
This timeline shows a graph from 1961 to 2016 of Sudan. No data until 1960. Number of actual observations by date: 56.
Source name:
World Development Indicators
Source organization:
World Bank national accounts data, and OECD National Accounts data files.
Categories, topics:
Economy & Growth, Trade
Last updated:
apr 23, 2017
Indicators value changes by year
Maximum:
24.096
jan 1, 2009
At the date of observation
Value
Absolute change
Change from previous value
jan 1, 1961
14.559
+14.559
0.0%
jan 1, 1962
13.316
-1.243
-8.54%
jan 1, 1963
14.616
+1.3
9.76%
jan 1, 1964
16.706
+2.089
14.3%
jan 1, 1965
15.536
-1.17
-7.0%
jan 1, 1966
14.232
-1.304
-8.39%
jan 1, 1967
14.316
+0.084
0.59%
jan 1, 1968
15.115
+0.799
5.58%
jan 1, 1969
15.115
-0.001
0.0%
jan 1, 1970
15.7
+0.586
3.87%
jan 1, 1971
16.341
+0.64
4.08%
jan 1, 1972
15.638
-0.703
-4.3%
jan 1, 1973
16.019
+0.381
2.44%
jan 1, 1974
14.848
-1.171
-7.31%
jan 1, 1975
12.709
-2.139
-14.4%
jan 1, 1976
12.094
-0.616
-4.85%
jan 1, 1977
11.224
-0.87
-7.19%
jan 1, 1978
9.375
-1.849
-16.47%
jan 1, 1979
7.92
-1.455
-15.52%
jan 1, 1980
9.956
+2.036
25.71%
jan 1, 1981
10.581
+0.625
6.28%
jan 1, 1982
9.619
-0.962
-9.09%
jan 1, 1983
9.935
+0.316
3.28%
jan 1, 1984
10.598
+0.663
6.67%
jan 1, 1985
8.458
-2.14
-20.19%
jan 1, 1986
5.747
-2.712
-32.06%
jan 1, 1987
4.74
-1.006
-17.51%
jan 1, 1988
5.522
+0.782
16.5%
jan 1, 1989
3.796
-1.727
-31.27%
jan 1, 1990
5.341
+1.546
40.73%
jan 1, 1991
4.021
-1.32
-24.71%
jan 1, 1992
3.335
-0.686
-17.07%
jan 1, 1993
5.246
+1.911
57.3%
jan 1, 1994
4.23
-1.016
-19.36%
jan 1, 1995
4.691
+0.46
10.88%
jan 1, 1996
4.969
+0.279
5.95%
jan 1, 1997
7.455
+2.485
50.01%
jan 1, 1998
5.344
-2.111
-28.32%
jan 1, 1999
6.702
+1.358
25.42%
jan 1, 2000
7.779
+1.077
16.07%
jan 1, 2001
15.985
+8.205
105.47%
jan 1, 2002
11.398
-4.587
-28.69%
jan 1, 2003
13.979
+2.581
22.65%
jan 1, 2004
14.828
+0.849
6.07%
jan 1, 2005
17.758
+2.93
19.76%
jan 1, 2006
19.178
+1.42
8.0%
jan 1, 2007
19.074
-0.104
-0.54%
jan 1, 2008
21.887
+2.813
14.75%
jan 1, 2009
24.096
+2.209
10.09%
jan 1, 2010
15.969
-8.127
-33.73%
jan 1, 2011
19.743
+3.775
23.64%
jan 1, 2012
17.568
-2.176
-11.02%
jan 1, 2013
9.219
-8.348
-47.52%
jan 1, 2014
8.841
-0.379
-4.11%
jan 1, 2015
8.149
-0.691
-7.82%
jan 1, 2016
8.182
+0.033
0.41%
Ranking of countries by current statistics by years


Comments: