29
/
en
AIzaSyAYiBZKx7MnpbEhh9jyipgxe19OcubqV5w
April 1, 2024
42325
Latin America & Caribbean (excluding high income)
LAC
false
2
1
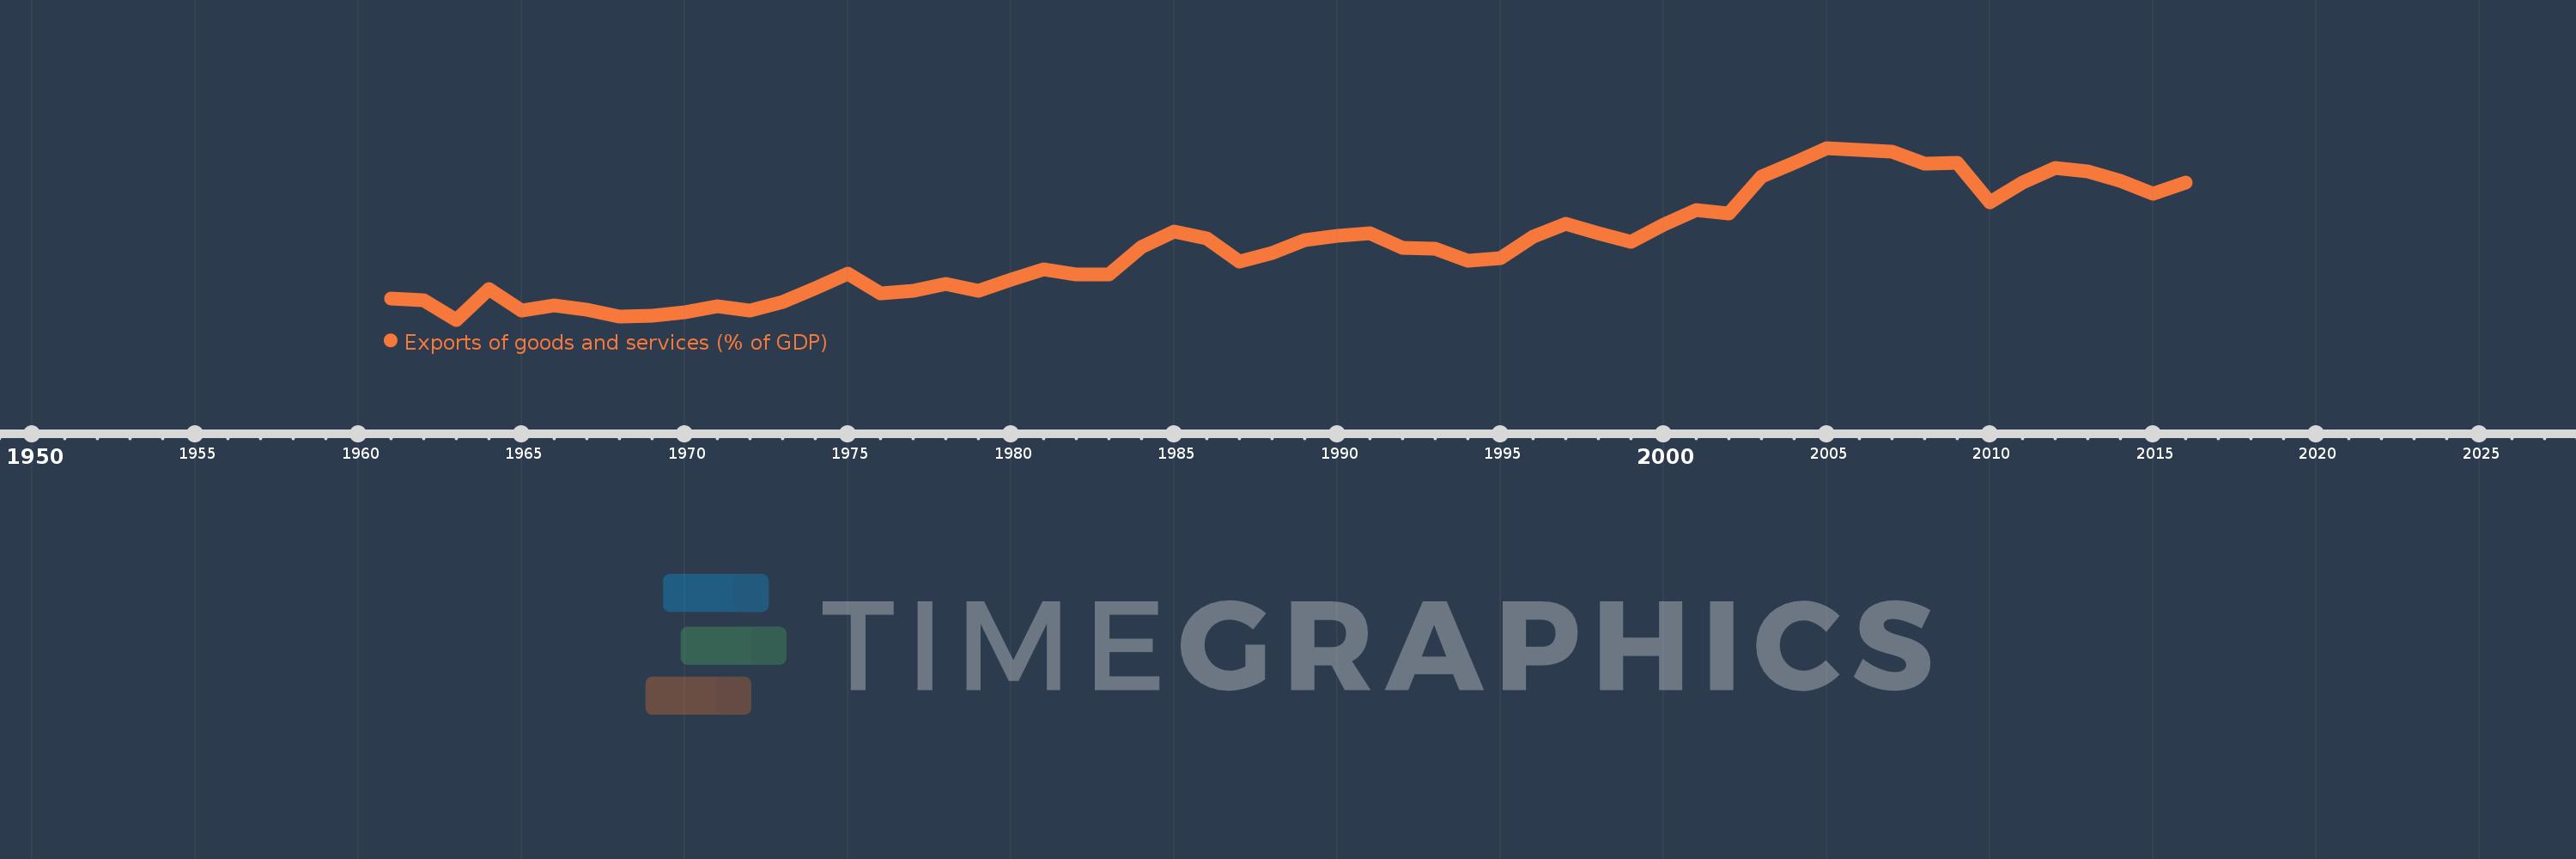
Exports of goods and services (% of GDP)
2016,2015,2014,2013,2012,2011,2010,2009,2008,2007,2006,2005,2004,2003,2002,2001,2000,1999,1998,1997,1996,1995,1994,1993,1992,1991,1990,1989,1988,1987,1986,1985,1984,1983,1982,1981,1980,1979,1978,1977,1976,1975,1974,1973,1972,1971,1970,1969,1968,1967,1966,1965,1964,1963,1962,1961
This statistics in other country:
AfghanistanAlbaniaAlgeriaAngolaAntigua and BarbudaArab WorldArgentinaArmeniaArubaAustraliaAustriaAzerbaijanBahamas, TheBahrainBangladeshBarbadosBelarusBelgiumBelizeBeninBermudaBhutanBoliviaBosnia and HerzegovinaBotswanaBrazilBrunei DarussalamBulgariaBurkina FasoBurundiCabo VerdeCambodiaCameroonCanadaCaribbean small statesCentral African RepublicCentral Europe and the BalticsChadChileChinaColombiaComorosCongo, Dem. Rep.Congo, Rep.Costa RicaCote d'IvoireCroatiaCubaCyprusCzech RepublicDenmarkDjiboutiDominicaDominican RepublicEarly-demographic dividendEast Asia & PacificEast Asia & Pacific (excluding high income)East Asia & Pacific (IDA & IBRD countries)EcuadorEgypt, Arab Rep.El SalvadorEquatorial GuineaEritreaEstoniaEthiopiaEuro areaEurope & Central AsiaEurope & Central Asia (excluding high income)Europe & Central Asia (IDA & IBRD countries)European UnionFaroe IslandsFijiFinlandFragile and conflict affected situationsFranceFrench PolynesiaGabonGambia, TheGeorgiaGermanyGhanaGreeceGrenadaGuatemalaGuineaGuinea-BissauGuyanaHaitiHeavily indebted poor countries (HIPC)High incomeHondurasHong Kong SAR, ChinaHungaryIBRD onlyIcelandIDA & IBRD totalIDA blendIDA onlyIDA totalIndiaIndonesiaIran, Islamic Rep.IraqIrelandIsraelItalyJamaicaJapanJordanKazakhstanKenyaKiribatiKorea, Rep.KosovoKuwaitKyrgyz RepublicLao PDRLate-demographic dividendLatin America & Caribbean Latin America & Caribbean (excluding high income)Latin America & the Caribbean (IDA & IBRD countries)LatviaLeast developed countries: UN classificationLebanonLesothoLiberiaLibyaLithuaniaLow & middle incomeLow incomeLower middle incomeLuxembourgMacao SAR, ChinaMacedonia, FYRMadagascarMalawiMalaysiaMaldivesMaliMaltaMauritaniaMauritiusMexicoMicronesia, Fed. Sts.Middle East & North AfricaMiddle East & North Africa (excluding high income)Middle East & North Africa (IDA & IBRD countries)Middle incomeMoldovaMongoliaMontenegroMoroccoMozambiqueMyanmarNamibiaNepalNetherlandsNew CaledoniaNew ZealandNicaraguaNigerNigeriaNorth AmericaNorwayOECD membersOmanOther small statesPacific island small statesPakistanPalauPanamaPapua New GuineaParaguayPeruPhilippinesPolandPortugalPost-demographic dividendPre-demographic dividendPuerto RicoQatarRomaniaRussian FederationRwandaSamoaSaudi ArabiaSenegalSerbiaSeychellesSierra LeoneSingaporeSlovak RepublicSloveniaSmall statesSolomon IslandsSomaliaSouth AfricaSouth AsiaSouth Asia (IDA & IBRD)South SudanSpainSri LankaSt. Kitts and NevisSt. LuciaSt. Vincent and the GrenadinesSub-Saharan Africa Sub-Saharan Africa (excluding high income)Sub-Saharan Africa (IDA & IBRD countries)SudanSurinameSwazilandSwedenSwitzerlandSyrian Arab RepublicTajikistanTanzaniaThailandTimor-LesteTogoTongaTrinidad and TobagoTunisiaTurkeyTurkmenistanUgandaUkraineUnited Arab EmiratesUnited KingdomUnited StatesUpper middle incomeUruguayUzbekistanVanuatuVenezuela, RBVietnamWest Bank and GazaWorldYemen, Rep.ZambiaZimbabwe Timeline:
This timeline shows a graph from 1961 to 2016 of Latin America & Caribbean (excluding high income). No data until 1960. Number of actual observations by date: 56.
Source name:
World Development Indicators
Source organization:
World Bank national accounts data, and OECD National Accounts data files.
Categories, topics:
Economy & Growth, Trade
Last updated:
apr 23, 2017
Indicators value changes by year
Maximum:
22.626
jan 1, 2005
At the date of observation
Value
Absolute change
Change from previous value
jan 1, 1961
10.903
+10.903
0.0%
jan 1, 1962
10.777
-0.126
-1.16%
jan 1, 1963
9.237
-1.539
-14.29%
jan 1, 1964
11.654
+2.416
26.16%
jan 1, 1965
9.95
-1.704
-14.62%
jan 1, 1966
10.385
+0.435
4.37%
jan 1, 1967
9.991
-0.394
-3.79%
jan 1, 1968
9.462
-0.529
-5.29%
jan 1, 1969
9.566
+0.104
1.1%
jan 1, 1970
9.811
+0.245
2.56%
jan 1, 1971
10.318
+0.506
5.16%
jan 1, 1972
9.967
-0.35
-3.4%
jan 1, 1973
10.614
+0.646
6.49%
jan 1, 1974
11.699
+1.085
10.22%
jan 1, 1975
12.831
+1.132
9.68%
jan 1, 1976
11.264
-1.567
-12.21%
jan 1, 1977
11.506
+0.242
2.15%
jan 1, 1978
12.033
+0.527
4.58%
jan 1, 1979
11.475
-0.558
-4.64%
jan 1, 1980
12.335
+0.86
7.49%
jan 1, 1981
13.144
+0.808
6.55%
jan 1, 1982
12.765
-0.378
-2.88%
jan 1, 1983
12.755
-0.01
-0.08%
jan 1, 1984
14.919
+2.164
16.96%
jan 1, 1985
16.115
+1.196
8.02%
jan 1, 1986
15.551
-0.564
-3.5%
jan 1, 1987
13.779
-1.772
-11.4%
jan 1, 1988
14.415
+0.636
4.61%
jan 1, 1989
15.413
+0.998
6.93%
jan 1, 1990
15.801
+0.387
2.51%
jan 1, 1991
15.947
+0.147
0.93%
jan 1, 1992
14.851
-1.097
-6.88%
jan 1, 1993
14.786
-0.065
-0.43%
jan 1, 1994
13.808
-0.978
-6.62%
jan 1, 1995
14.041
+0.233
1.68%
jan 1, 1996
15.744
+1.704
12.14%
jan 1, 1997
16.682
+0.937
5.95%
jan 1, 1998
15.965
-0.716
-4.29%
jan 1, 1999
15.304
-0.661
-4.14%
jan 1, 2000
16.65
+1.346
8.8%
jan 1, 2001
17.812
+1.162
6.98%
jan 1, 2002
17.492
-0.32
-1.79%
jan 1, 2003
20.39
+2.898
16.57%
jan 1, 2004
21.484
+1.094
5.36%
jan 1, 2005
22.626
+1.142
5.31%
jan 1, 2006
22.488
-0.137
-0.61%
jan 1, 2007
22.314
-0.174
-0.78%
jan 1, 2008
21.419
-0.895
-4.01%
jan 1, 2009
21.499
+0.08
0.37%
jan 1, 2010
18.41
-3.09
-14.37%
jan 1, 2011
19.921
+1.512
8.21%
jan 1, 2012
21.045
+1.123
5.64%
jan 1, 2013
20.815
-0.229
-1.09%
jan 1, 2014
20.069
-0.746
-3.58%
jan 1, 2015
19.055
-1.014
-5.05%
jan 1, 2016
19.918
+0.863
4.53%
Ranking of countries by current statistics by years


Comments: