29
/
en
AIzaSyAYiBZKx7MnpbEhh9jyipgxe19OcubqV5w
April 1, 2024
219509
Papua New Guinea
PNG
true
2
1
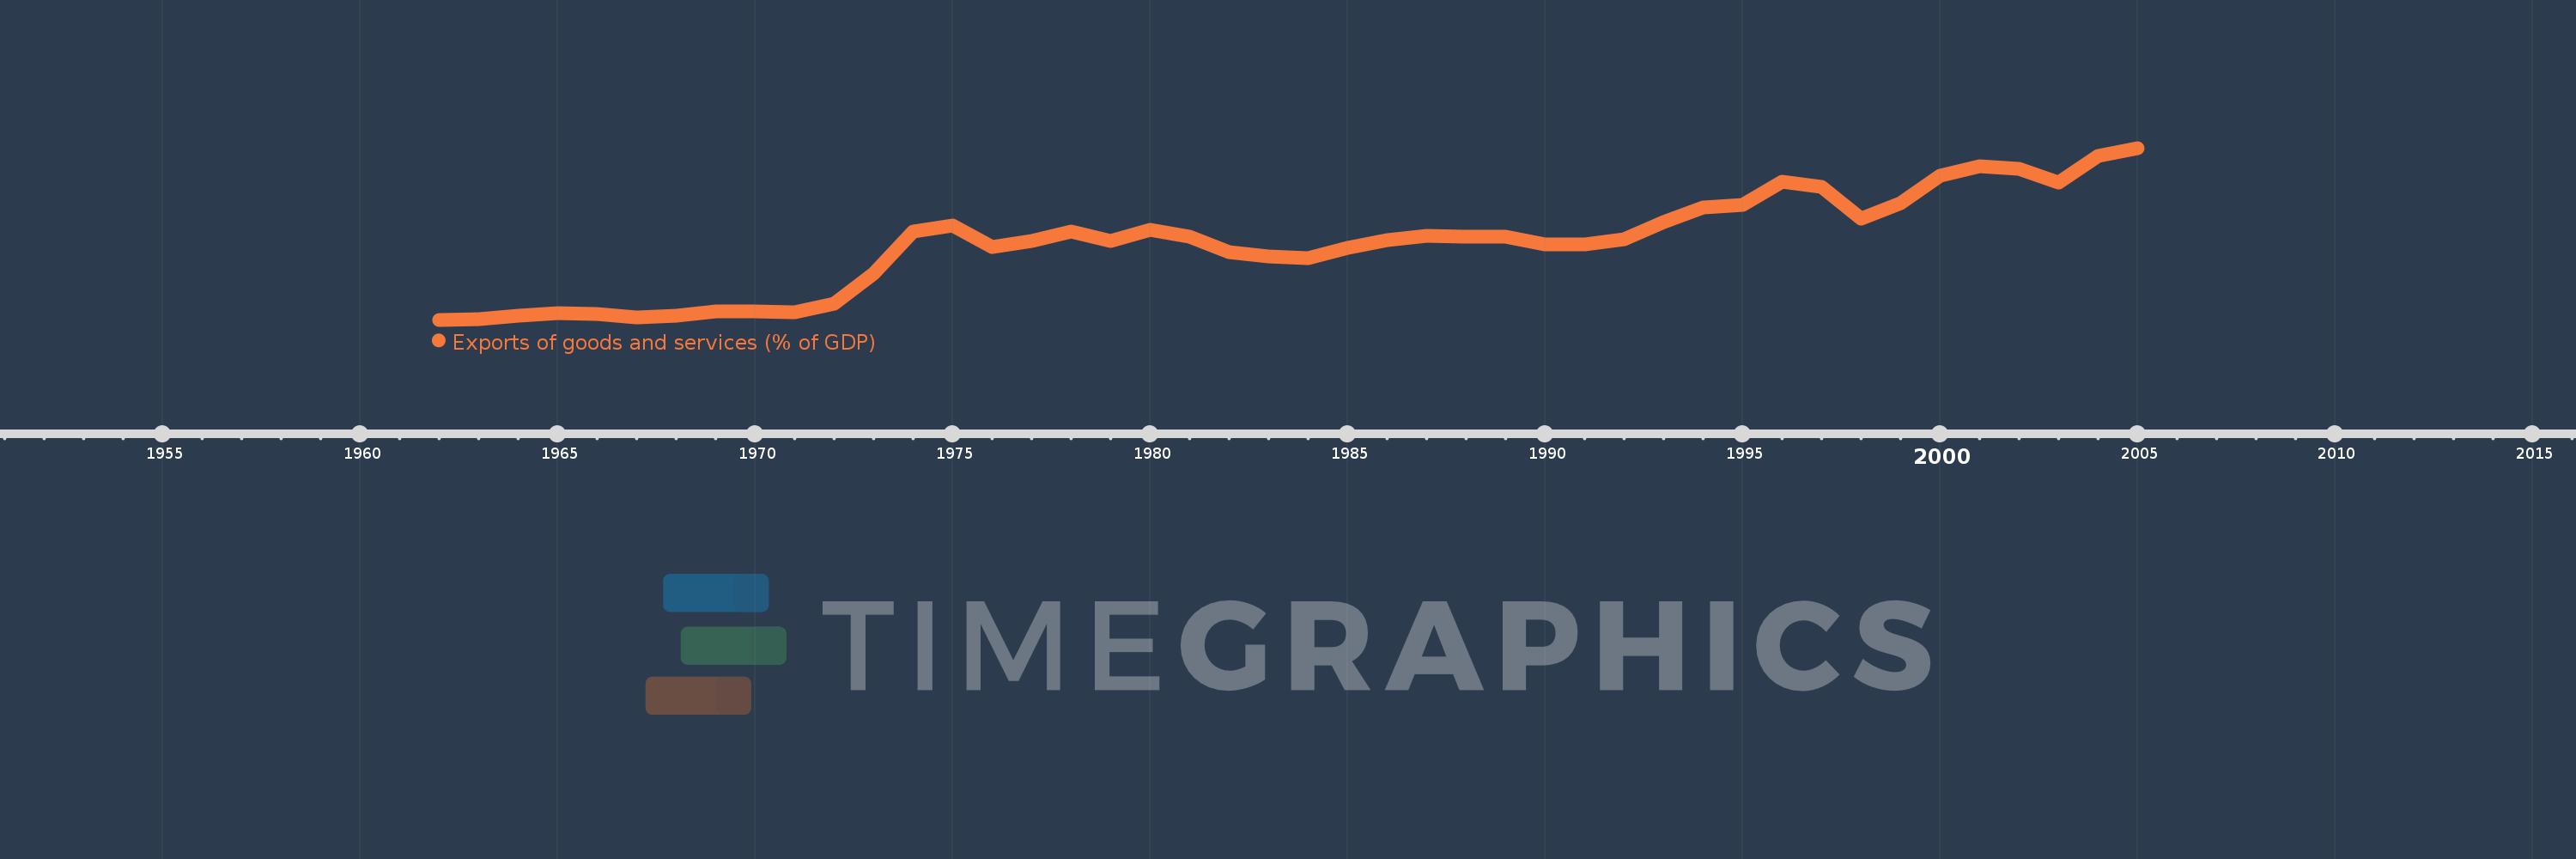
Exports of goods and services (% of GDP)
2005,2004,2003,2002,2001,2000,1999,1998,1997,1996,1995,1994,1993,1992,1991,1990,1989,1988,1987,1986,1985,1984,1983,1982,1981,1980,1979,1978,1977,1976,1975,1974,1973,1972,1971,1970,1969,1968,1967,1966,1965,1964,1963,1962
This statistics in other country:
AfghanistanAlbaniaAlgeriaAngolaAntigua and BarbudaArab WorldArgentinaArmeniaArubaAustraliaAustriaAzerbaijanBahamas, TheBahrainBangladeshBarbadosBelarusBelgiumBelizeBeninBermudaBhutanBoliviaBosnia and HerzegovinaBotswanaBrazilBrunei DarussalamBulgariaBurkina FasoBurundiCabo VerdeCambodiaCameroonCanadaCaribbean small statesCentral African RepublicCentral Europe and the BalticsChadChileChinaColombiaComorosCongo, Dem. Rep.Congo, Rep.Costa RicaCote d'IvoireCroatiaCubaCyprusCzech RepublicDenmarkDjiboutiDominicaDominican RepublicEarly-demographic dividendEast Asia & PacificEast Asia & Pacific (excluding high income)East Asia & Pacific (IDA & IBRD countries)EcuadorEgypt, Arab Rep.El SalvadorEquatorial GuineaEritreaEstoniaEthiopiaEuro areaEurope & Central AsiaEurope & Central Asia (excluding high income)Europe & Central Asia (IDA & IBRD countries)European UnionFaroe IslandsFijiFinlandFragile and conflict affected situationsFranceFrench PolynesiaGabonGambia, TheGeorgiaGermanyGhanaGreeceGrenadaGuatemalaGuineaGuinea-BissauGuyanaHaitiHeavily indebted poor countries (HIPC)High incomeHondurasHong Kong SAR, ChinaHungaryIBRD onlyIcelandIDA & IBRD totalIDA blendIDA onlyIDA totalIndiaIndonesiaIran, Islamic Rep.IraqIrelandIsraelItalyJamaicaJapanJordanKazakhstanKenyaKiribatiKorea, Rep.KosovoKuwaitKyrgyz RepublicLao PDRLate-demographic dividendLatin America & Caribbean Latin America & Caribbean (excluding high income)Latin America & the Caribbean (IDA & IBRD countries)LatviaLeast developed countries: UN classificationLebanonLesothoLiberiaLibyaLithuaniaLow & middle incomeLow incomeLower middle incomeLuxembourgMacao SAR, ChinaMacedonia, FYRMadagascarMalawiMalaysiaMaldivesMaliMaltaMauritaniaMauritiusMexicoMicronesia, Fed. Sts.Middle East & North AfricaMiddle East & North Africa (excluding high income)Middle East & North Africa (IDA & IBRD countries)Middle incomeMoldovaMongoliaMontenegroMoroccoMozambiqueMyanmarNamibiaNepalNetherlandsNew CaledoniaNew ZealandNicaraguaNigerNigeriaNorth AmericaNorwayOECD membersOmanOther small statesPacific island small statesPakistanPalauPanamaPapua New GuineaParaguayPeruPhilippinesPolandPortugalPost-demographic dividendPre-demographic dividendPuerto RicoQatarRomaniaRussian FederationRwandaSamoaSaudi ArabiaSenegalSerbiaSeychellesSierra LeoneSingaporeSlovak RepublicSloveniaSmall statesSolomon IslandsSomaliaSouth AfricaSouth AsiaSouth Asia (IDA & IBRD)South SudanSpainSri LankaSt. Kitts and NevisSt. LuciaSt. Vincent and the GrenadinesSub-Saharan Africa Sub-Saharan Africa (excluding high income)Sub-Saharan Africa (IDA & IBRD countries)SudanSurinameSwazilandSwedenSwitzerlandSyrian Arab RepublicTajikistanTanzaniaThailandTimor-LesteTogoTongaTrinidad and TobagoTunisiaTurkeyTurkmenistanUgandaUkraineUnited Arab EmiratesUnited KingdomUnited StatesUpper middle incomeUruguayUzbekistanVanuatuVenezuela, RBVietnamWest Bank and GazaWorldYemen, Rep.ZambiaZimbabwe Timeline:
This timeline shows a graph from 1962 to 2005 of Papua New Guinea. No data until 1961. Number of actual observations by date: 44.
Source name:
World Development Indicators
Source organization:
World Bank national accounts data, and OECD National Accounts data files.
Categories, topics:
Economy & Growth, Trade
Last updated:
apr 23, 2017
Indicators value changes by year
Minimum:
16.102
jan 1, 1962
Maximum:
72.164
jan 1, 2005
At the date of observation
Value
Absolute change
Change from previous value
jan 1, 1962
16.102
+16.102
0.0%
jan 1, 1963
16.209
+0.107
0.66%
jan 1, 1964
17.411
+1.201
7.41%
jan 1, 1965
18.305
+0.894
5.14%
jan 1, 1966
18.028
-0.277
-1.51%
jan 1, 1967
16.786
-1.242
-6.89%
jan 1, 1968
17.368
+0.582
3.47%
jan 1, 1969
18.86
+1.491
8.59%
jan 1, 1970
18.915
+0.055
0.29%
jan 1, 1971
18.477
-0.438
-2.32%
jan 1, 1972
21.37
+2.893
15.66%
jan 1, 1973
31.209
+9.839
46.04%
jan 1, 1974
44.878
+13.669
43.8%
jan 1, 1975
46.884
+2.006
4.47%
jan 1, 1976
39.979
-6.906
-14.73%
jan 1, 1977
41.774
+1.795
4.49%
jan 1, 1978
44.975
+3.201
7.66%
jan 1, 1979
41.936
-3.039
-6.76%
jan 1, 1980
45.48
+3.543
8.45%
jan 1, 1981
43.182
-2.297
-5.05%
jan 1, 1982
38.241
-4.942
-11.44%
jan 1, 1983
36.834
-1.407
-3.68%
jan 1, 1984
36.196
-0.638
-1.73%
jan 1, 1985
39.443
+3.247
8.97%
jan 1, 1986
42.115
+2.672
6.77%
jan 1, 1987
43.58
+1.465
3.48%
jan 1, 1988
43.166
-0.413
-0.95%
jan 1, 1989
43.251
+0.085
0.2%
jan 1, 1990
40.647
-2.604
-6.02%
jan 1, 1991
40.625
-0.023
-0.06%
jan 1, 1992
42.265
+1.64
4.04%
jan 1, 1993
47.85
+5.585
13.21%
jan 1, 1994
52.643
+4.793
10.02%
jan 1, 1995
53.535
+0.891
1.69%
jan 1, 1996
61.039
+7.504
14.02%
jan 1, 1997
59.405
-1.634
-2.68%
jan 1, 1998
49.158
-10.247
-17.25%
jan 1, 1999
54.041
+4.884
9.94%
jan 1, 2000
63.118
+9.077
16.8%
jan 1, 2001
66.178
+3.06
4.85%
jan 1, 2002
65.33
-0.848
-1.28%
jan 1, 2003
60.916
-4.414
-6.76%
jan 1, 2004
69.418
+8.502
13.96%
jan 1, 2005
72.164
+2.746
3.96%
Ranking of countries by current statistics by years


Comments: