29
/
en
AIzaSyAYiBZKx7MnpbEhh9jyipgxe19OcubqV5w
April 1, 2024
269252
Turkey
TUR
true
2
1
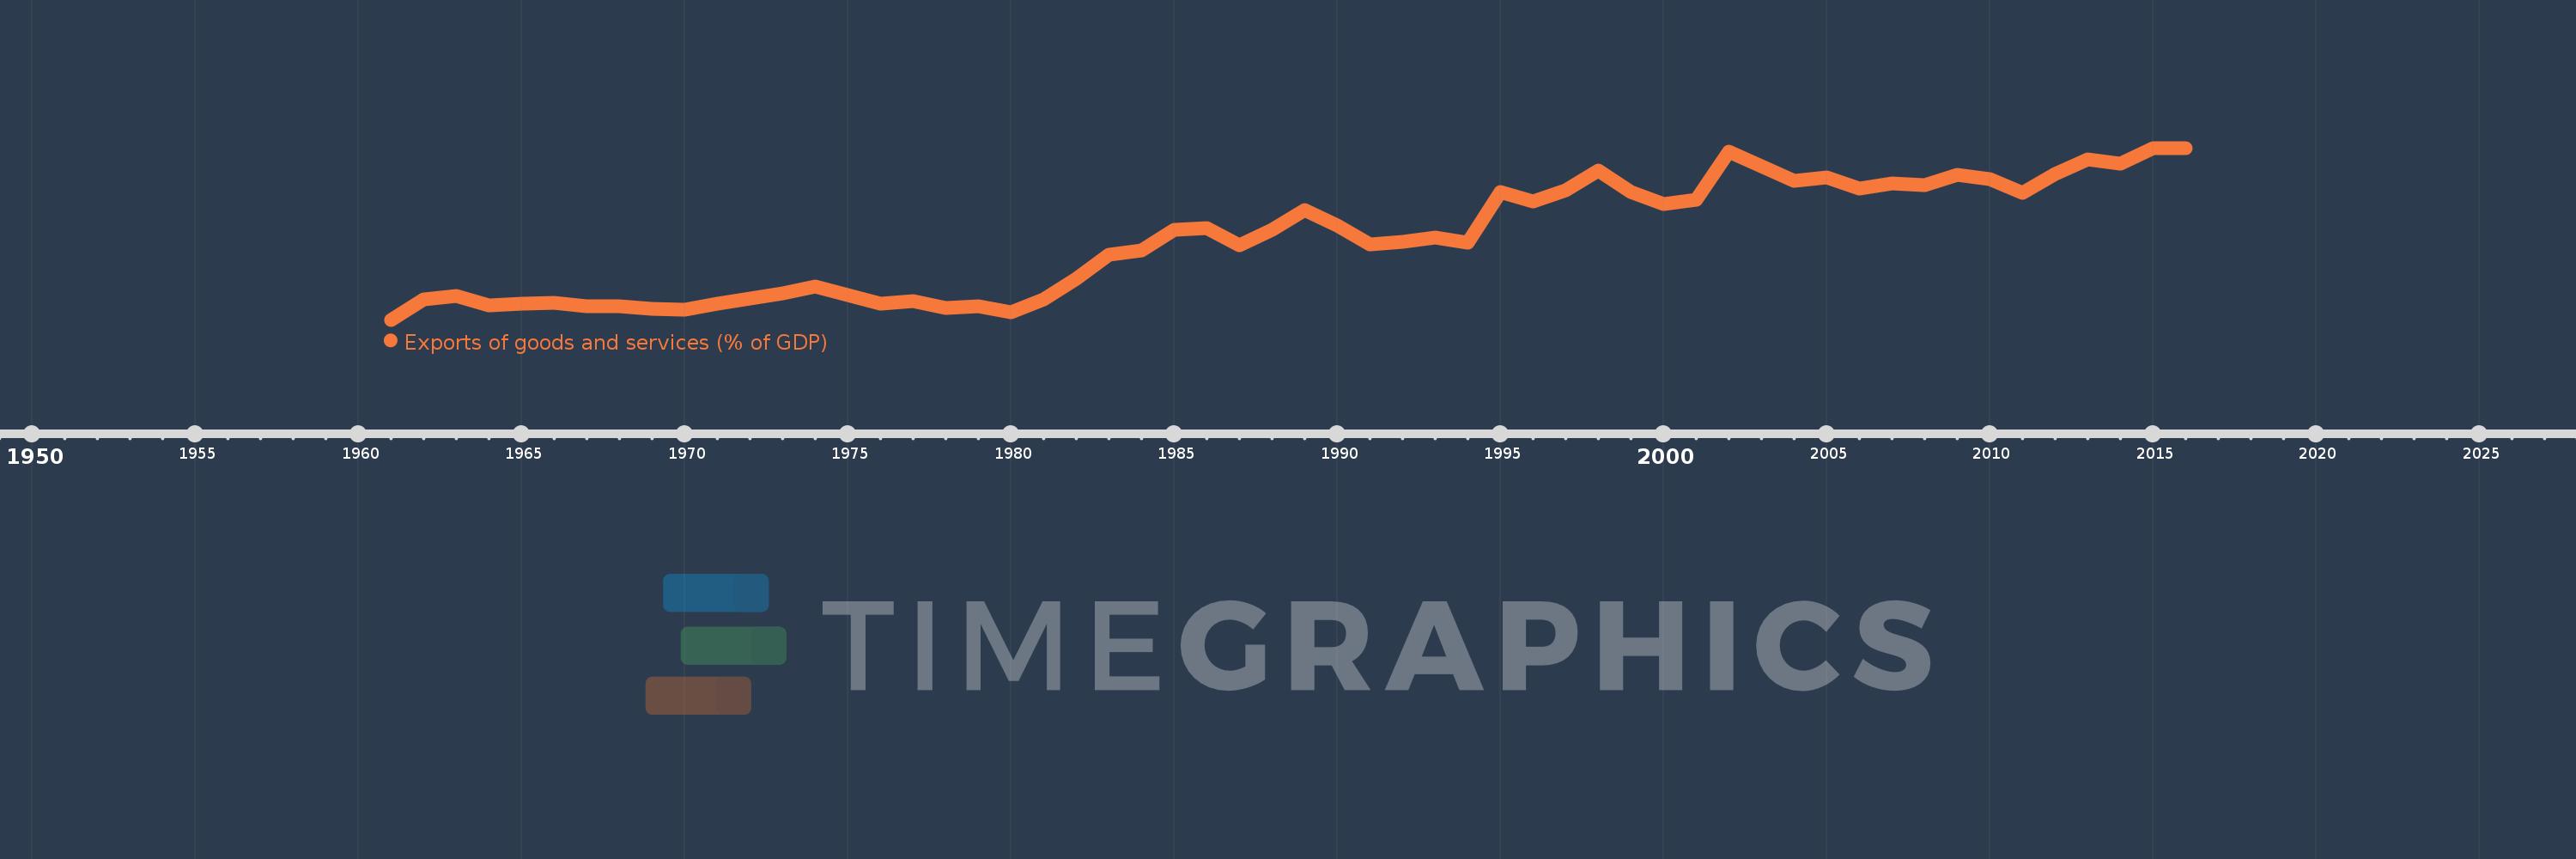
Exports of goods and services (% of GDP)
2016,2015,2014,2013,2012,2011,2010,2009,2008,2007,2006,2005,2004,2003,2002,2001,2000,1999,1998,1997,1996,1995,1994,1993,1992,1991,1990,1989,1988,1987,1986,1985,1984,1983,1982,1981,1980,1979,1978,1977,1976,1975,1974,1973,1972,1971,1970,1969,1968,1967,1966,1965,1964,1963,1962,1961
This statistics in other country:
AfghanistanAlbaniaAlgeriaAngolaAntigua and BarbudaArab WorldArgentinaArmeniaArubaAustraliaAustriaAzerbaijanBahamas, TheBahrainBangladeshBarbadosBelarusBelgiumBelizeBeninBermudaBhutanBoliviaBosnia and HerzegovinaBotswanaBrazilBrunei DarussalamBulgariaBurkina FasoBurundiCabo VerdeCambodiaCameroonCanadaCaribbean small statesCentral African RepublicCentral Europe and the BalticsChadChileChinaColombiaComorosCongo, Dem. Rep.Congo, Rep.Costa RicaCote d'IvoireCroatiaCubaCyprusCzech RepublicDenmarkDjiboutiDominicaDominican RepublicEarly-demographic dividendEast Asia & PacificEast Asia & Pacific (excluding high income)East Asia & Pacific (IDA & IBRD countries)EcuadorEgypt, Arab Rep.El SalvadorEquatorial GuineaEritreaEstoniaEthiopiaEuro areaEurope & Central AsiaEurope & Central Asia (excluding high income)Europe & Central Asia (IDA & IBRD countries)European UnionFaroe IslandsFijiFinlandFragile and conflict affected situationsFranceFrench PolynesiaGabonGambia, TheGeorgiaGermanyGhanaGreeceGrenadaGuatemalaGuineaGuinea-BissauGuyanaHaitiHeavily indebted poor countries (HIPC)High incomeHondurasHong Kong SAR, ChinaHungaryIBRD onlyIcelandIDA & IBRD totalIDA blendIDA onlyIDA totalIndiaIndonesiaIran, Islamic Rep.IraqIrelandIsraelItalyJamaicaJapanJordanKazakhstanKenyaKiribatiKorea, Rep.KosovoKuwaitKyrgyz RepublicLao PDRLate-demographic dividendLatin America & Caribbean Latin America & Caribbean (excluding high income)Latin America & the Caribbean (IDA & IBRD countries)LatviaLeast developed countries: UN classificationLebanonLesothoLiberiaLibyaLithuaniaLow & middle incomeLow incomeLower middle incomeLuxembourgMacao SAR, ChinaMacedonia, FYRMadagascarMalawiMalaysiaMaldivesMaliMaltaMauritaniaMauritiusMexicoMicronesia, Fed. Sts.Middle East & North AfricaMiddle East & North Africa (excluding high income)Middle East & North Africa (IDA & IBRD countries)Middle incomeMoldovaMongoliaMontenegroMoroccoMozambiqueMyanmarNamibiaNepalNetherlandsNew CaledoniaNew ZealandNicaraguaNigerNigeriaNorth AmericaNorwayOECD membersOmanOther small statesPacific island small statesPakistanPalauPanamaPapua New GuineaParaguayPeruPhilippinesPolandPortugalPost-demographic dividendPre-demographic dividendPuerto RicoQatarRomaniaRussian FederationRwandaSamoaSaudi ArabiaSenegalSerbiaSeychellesSierra LeoneSingaporeSlovak RepublicSloveniaSmall statesSolomon IslandsSomaliaSouth AfricaSouth AsiaSouth Asia (IDA & IBRD)South SudanSpainSri LankaSt. Kitts and NevisSt. LuciaSt. Vincent and the GrenadinesSub-Saharan Africa Sub-Saharan Africa (excluding high income)Sub-Saharan Africa (IDA & IBRD countries)SudanSurinameSwazilandSwedenSwitzerlandSyrian Arab RepublicTajikistanTanzaniaThailandTimor-LesteTogoTongaTrinidad and TobagoTunisiaTurkeyTurkmenistanUgandaUkraineUnited Arab EmiratesUnited KingdomUnited StatesUpper middle incomeUruguayUzbekistanVanuatuVenezuela, RBVietnamWest Bank and GazaWorldYemen, Rep.ZambiaZimbabwe Timeline:
This timeline shows a graph from 1961 to 2016 of Turkey. No data until 1960. Number of actual observations by date: 56.
Source name:
World Development Indicators
Source organization:
World Bank national accounts data, and OECD National Accounts data files.
Categories, topics:
Economy & Growth, Trade
Last updated:
apr 23, 2017
Indicators value changes by year
Maximum:
27.961
jan 1, 2016
At the date of observation
Value
Absolute change
Change from previous value
jan 1, 1961
2.056
+2.056
0.0%
jan 1, 1962
5.125
+3.069
149.28%
jan 1, 1963
5.604
+0.479
9.35%
jan 1, 1964
4.185
-1.419
-25.33%
jan 1, 1965
4.473
+0.289
6.9%
jan 1, 1966
4.558
+0.085
1.9%
jan 1, 1967
4.091
-0.467
-10.24%
jan 1, 1968
4.113
+0.022
0.54%
jan 1, 1969
3.683
-0.431
-10.48%
jan 1, 1970
3.596
-0.087
-2.35%
jan 1, 1971
4.427
+0.832
23.13%
jan 1, 1972
5.32
+0.892
20.15%
jan 1, 1973
6.019
+0.699
13.14%
jan 1, 1974
7.033
+1.014
16.85%
jan 1, 1975
5.728
-1.305
-18.55%
jan 1, 1976
4.421
-1.307
-22.81%
jan 1, 1977
4.859
+0.438
9.9%
jan 1, 1978
3.815
-1.044
-21.48%
jan 1, 1979
4.147
+0.332
8.69%
jan 1, 1980
3.218
-0.929
-22.4%
jan 1, 1981
5.162
+1.944
60.41%
jan 1, 1982
8.237
+3.075
59.57%
jan 1, 1983
11.864
+3.627
44.03%
jan 1, 1984
12.473
+0.609
5.13%
jan 1, 1985
15.607
+3.133
25.12%
jan 1, 1986
15.861
+0.254
1.63%
jan 1, 1987
13.312
-2.548
-16.07%
jan 1, 1988
15.581
+2.268
17.04%
jan 1, 1989
18.654
+3.073
19.72%
jan 1, 1990
16.203
-2.451
-13.14%
jan 1, 1991
13.365
-2.838
-17.51%
jan 1, 1992
13.841
+0.476
3.56%
jan 1, 1993
14.392
+0.551
3.98%
jan 1, 1994
13.674
-0.718
-4.99%
jan 1, 1995
21.362
+7.688
56.23%
jan 1, 1996
19.892
-1.471
-6.88%
jan 1, 1997
21.543
+1.651
8.3%
jan 1, 1998
24.582
+3.039
14.11%
jan 1, 1999
21.338
-3.244
-13.2%
jan 1, 2000
19.44
-1.898
-8.89%
jan 1, 2001
20.098
+0.658
3.38%
jan 1, 2002
27.441
+7.343
36.54%
jan 1, 2003
25.217
-2.224
-8.1%
jan 1, 2004
22.995
-2.223
-8.81%
jan 1, 2005
23.552
+0.557
2.42%
jan 1, 2006
21.855
-1.696
-7.2%
jan 1, 2007
22.67
+0.815
3.73%
jan 1, 2008
22.323
-0.347
-1.53%
jan 1, 2009
23.908
+1.585
7.1%
jan 1, 2010
23.316
-0.591
-2.47%
jan 1, 2011
21.209
-2.107
-9.04%
jan 1, 2012
23.977
+2.767
13.05%
jan 1, 2013
26.296
+2.319
9.67%
jan 1, 2014
25.636
-0.66
-2.51%
jan 1, 2015
27.885
+2.249
8.77%
jan 1, 2016
27.961
+0.076
0.27%
Ranking of countries by current statistics by years


Comments: