29
/
en
AIzaSyAYiBZKx7MnpbEhh9jyipgxe19OcubqV5w
April 1, 2024
147882
Guyana
GUY
true
2
1
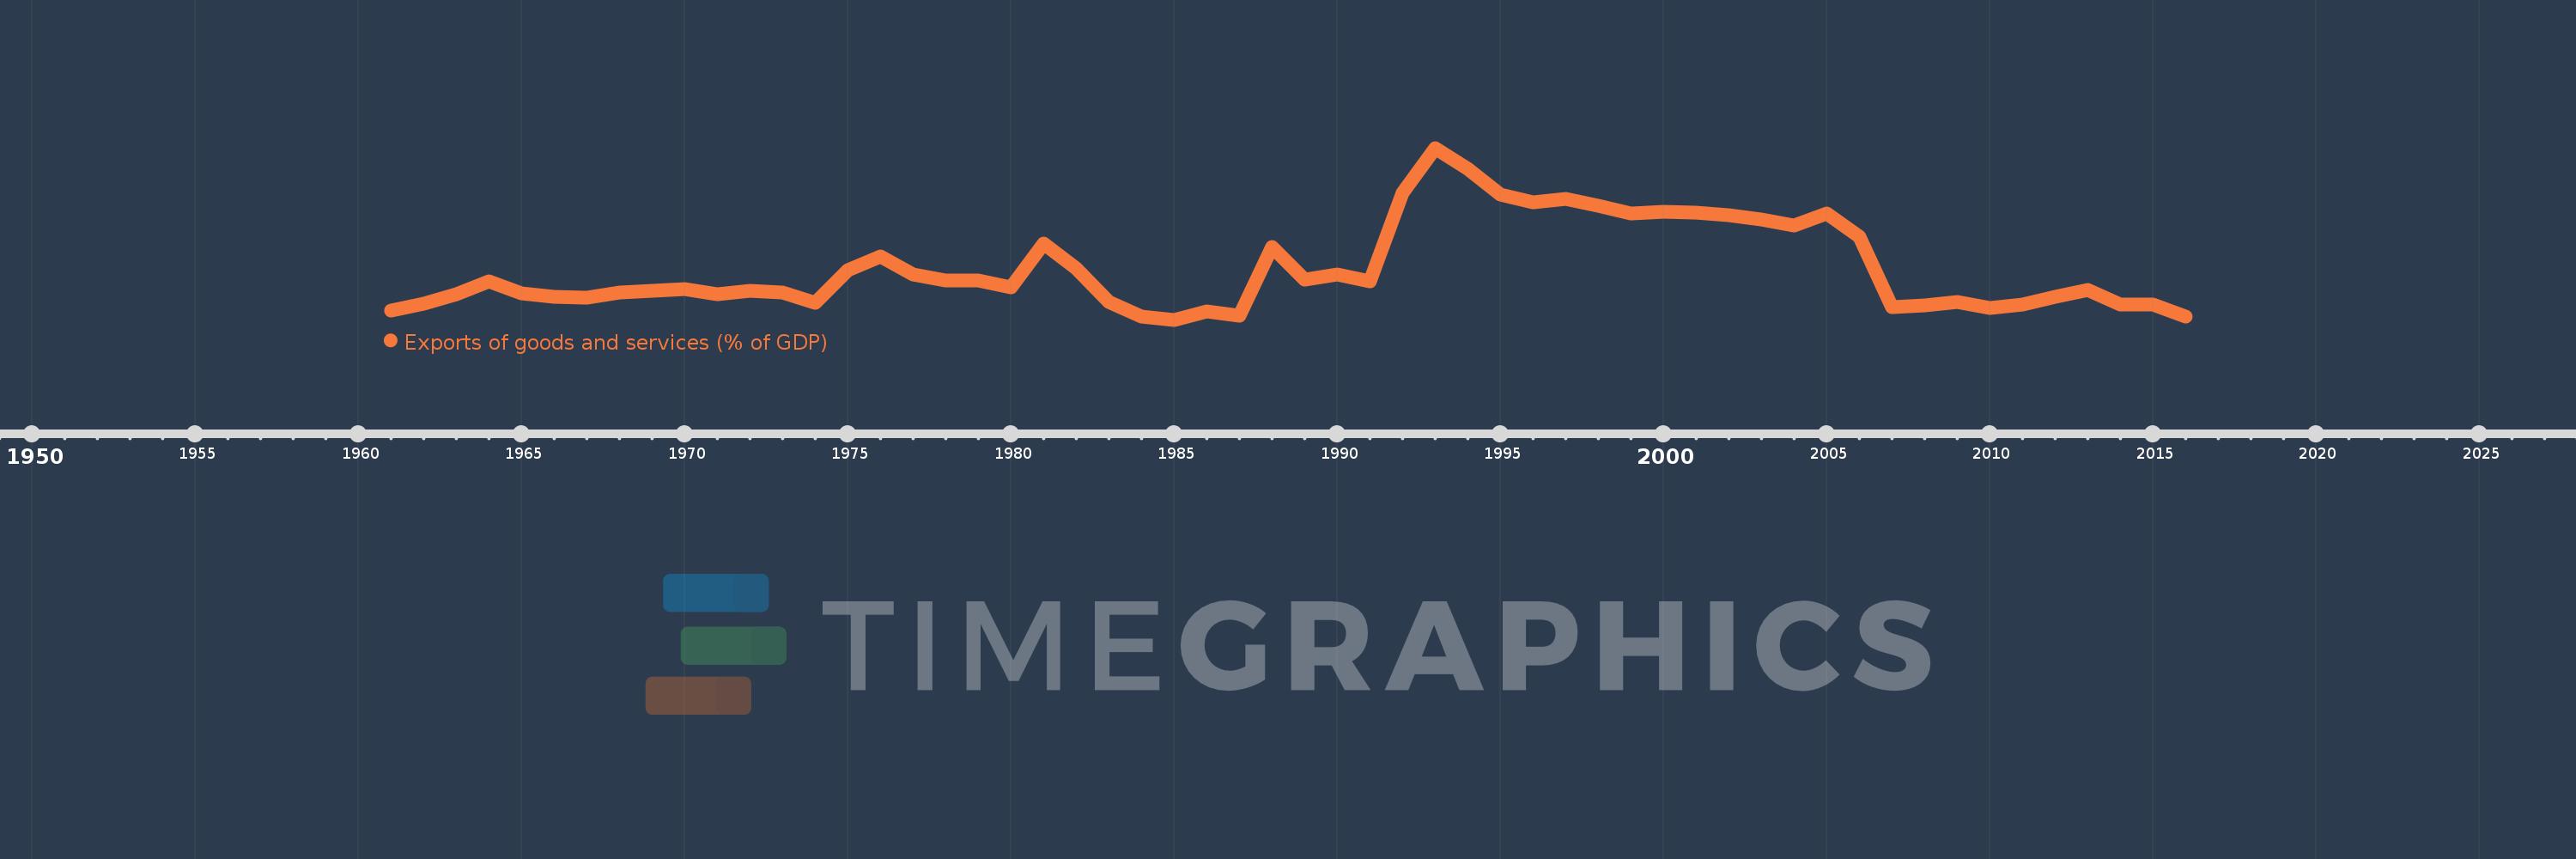
Exports of goods and services (% of GDP)
2016,2015,2014,2013,2012,2011,2010,2009,2008,2007,2006,2005,2004,2003,2002,2001,2000,1999,1998,1997,1996,1995,1994,1993,1992,1991,1990,1989,1988,1987,1986,1985,1984,1983,1982,1981,1980,1979,1978,1977,1976,1975,1974,1973,1972,1971,1970,1969,1968,1967,1966,1965,1964,1963,1962,1961
This statistics in other country:
AfghanistanAlbaniaAlgeriaAngolaAntigua and BarbudaArab WorldArgentinaArmeniaArubaAustraliaAustriaAzerbaijanBahamas, TheBahrainBangladeshBarbadosBelarusBelgiumBelizeBeninBermudaBhutanBoliviaBosnia and HerzegovinaBotswanaBrazilBrunei DarussalamBulgariaBurkina FasoBurundiCabo VerdeCambodiaCameroonCanadaCaribbean small statesCentral African RepublicCentral Europe and the BalticsChadChileChinaColombiaComorosCongo, Dem. Rep.Congo, Rep.Costa RicaCote d'IvoireCroatiaCubaCyprusCzech RepublicDenmarkDjiboutiDominicaDominican RepublicEarly-demographic dividendEast Asia & PacificEast Asia & Pacific (excluding high income)East Asia & Pacific (IDA & IBRD countries)EcuadorEgypt, Arab Rep.El SalvadorEquatorial GuineaEritreaEstoniaEthiopiaEuro areaEurope & Central AsiaEurope & Central Asia (excluding high income)Europe & Central Asia (IDA & IBRD countries)European UnionFaroe IslandsFijiFinlandFragile and conflict affected situationsFranceFrench PolynesiaGabonGambia, TheGeorgiaGermanyGhanaGreeceGrenadaGuatemalaGuineaGuinea-BissauGuyanaHaitiHeavily indebted poor countries (HIPC)High incomeHondurasHong Kong SAR, ChinaHungaryIBRD onlyIcelandIDA & IBRD totalIDA blendIDA onlyIDA totalIndiaIndonesiaIran, Islamic Rep.IraqIrelandIsraelItalyJamaicaJapanJordanKazakhstanKenyaKiribatiKorea, Rep.KosovoKuwaitKyrgyz RepublicLao PDRLate-demographic dividendLatin America & Caribbean Latin America & Caribbean (excluding high income)Latin America & the Caribbean (IDA & IBRD countries)LatviaLeast developed countries: UN classificationLebanonLesothoLiberiaLibyaLithuaniaLow & middle incomeLow incomeLower middle incomeLuxembourgMacao SAR, ChinaMacedonia, FYRMadagascarMalawiMalaysiaMaldivesMaliMaltaMauritaniaMauritiusMexicoMicronesia, Fed. Sts.Middle East & North AfricaMiddle East & North Africa (excluding high income)Middle East & North Africa (IDA & IBRD countries)Middle incomeMoldovaMongoliaMontenegroMoroccoMozambiqueMyanmarNamibiaNepalNetherlandsNew CaledoniaNew ZealandNicaraguaNigerNigeriaNorth AmericaNorwayOECD membersOmanOther small statesPacific island small statesPakistanPalauPanamaPapua New GuineaParaguayPeruPhilippinesPolandPortugalPost-demographic dividendPre-demographic dividendPuerto RicoQatarRomaniaRussian FederationRwandaSamoaSaudi ArabiaSenegalSerbiaSeychellesSierra LeoneSingaporeSlovak RepublicSloveniaSmall statesSolomon IslandsSomaliaSouth AfricaSouth AsiaSouth Asia (IDA & IBRD)South SudanSpainSri LankaSt. Kitts and NevisSt. LuciaSt. Vincent and the GrenadinesSub-Saharan Africa Sub-Saharan Africa (excluding high income)Sub-Saharan Africa (IDA & IBRD countries)SudanSurinameSwazilandSwedenSwitzerlandSyrian Arab RepublicTajikistanTanzaniaThailandTimor-LesteTogoTongaTrinidad and TobagoTunisiaTurkeyTurkmenistanUgandaUkraineUnited Arab EmiratesUnited KingdomUnited StatesUpper middle incomeUruguayUzbekistanVanuatuVenezuela, RBVietnamWest Bank and GazaWorldYemen, Rep.ZambiaZimbabwe Timeline:
This timeline shows a graph from 1961 to 2016 of Guyana. No data until 1960. Number of actual observations by date: 56.
Source name:
World Development Indicators
Source organization:
World Bank national accounts data, and OECD National Accounts data files.
Categories, topics:
Economy & Growth, Trade
Last updated:
apr 23, 2017
Indicators value changes by year
Minimum:
44.161
jan 1, 1985
Maximum:
127.555
jan 1, 1993
At the date of observation
Value
Absolute change
Change from previous value
jan 1, 1961
48.732
+48.732
0.0%
jan 1, 1962
52.072
+3.34
6.85%
jan 1, 1963
56.643
+4.571
8.78%
jan 1, 1964
62.927
+6.285
11.1%
jan 1, 1965
57.113
-5.814
-9.24%
jan 1, 1966
55.255
-1.858
-3.25%
jan 1, 1967
54.99
-0.265
-0.48%
jan 1, 1968
57.442
+2.452
4.46%
jan 1, 1969
58.237
+0.795
1.38%
jan 1, 1970
59.246
+1.009
1.73%
jan 1, 1971
56.46
-2.786
-4.7%
jan 1, 1972
58.412
+1.952
3.46%
jan 1, 1973
57.467
-0.945
-1.62%
jan 1, 1974
52.187
-5.28
-9.19%
jan 1, 1975
68.346
+16.159
30.96%
jan 1, 1976
74.88
+6.534
9.56%
jan 1, 1977
66.077
-8.803
-11.76%
jan 1, 1978
63.208
-2.869
-4.34%
jan 1, 1979
63.083
-0.125
-0.2%
jan 1, 1980
59.807
-3.276
-5.19%
jan 1, 1981
81.286
+21.48
35.91%
jan 1, 1982
68.923
-12.363
-15.21%
jan 1, 1983
52.78
-16.143
-23.42%
jan 1, 1984
45.879
-6.901
-13.08%
jan 1, 1985
44.161
-1.718
-3.74%
jan 1, 1986
48.087
+3.926
8.89%
jan 1, 1987
46.304
-1.783
-3.71%
jan 1, 1988
79.568
+33.264
71.84%
jan 1, 1989
63.63
-15.939
-20.03%
jan 1, 1990
66.341
+2.711
4.26%
jan 1, 1991
62.707
-3.634
-5.48%
jan 1, 1992
105.908
+43.201
68.89%
jan 1, 1993
127.555
+21.648
20.44%
jan 1, 1994
117.38
-10.175
-7.98%
jan 1, 1995
104.952
-12.428
-10.59%
jan 1, 1996
101.211
-3.741
-3.56%
jan 1, 1997
102.621
+1.411
1.39%
jan 1, 1998
99.66
-2.961
-2.89%
jan 1, 1999
95.933
-3.727
-3.74%
jan 1, 2000
96.508
+0.576
0.6%
jan 1, 2001
96.08
-0.428
-0.44%
jan 1, 2002
94.993
-1.087
-1.13%
jan 1, 2003
92.772
-2.221
-2.34%
jan 1, 2004
89.814
-2.958
-3.19%
jan 1, 2005
95.793
+5.979
6.66%
jan 1, 2006
84.623
-11.17
-11.66%
jan 1, 2007
50.372
-34.251
-40.47%
jan 1, 2008
51.231
+0.859
1.71%
jan 1, 2009
52.795
+1.563
3.05%
jan 1, 2010
49.797
-2.998
-5.68%
jan 1, 2011
51.702
+1.905
3.83%
jan 1, 2012
55.329
+3.627
7.02%
jan 1, 2013
58.445
+3.116
5.63%
jan 1, 2014
51.605
-6.84
-11.7%
jan 1, 2015
51.388
-0.216
-0.42%
jan 1, 2016
45.696
-5.693
-11.08%
Ranking of countries by current statistics by years


Comments: