29
/
en
AIzaSyAYiBZKx7MnpbEhh9jyipgxe19OcubqV5w
April 1, 2024
48081
Middle East & North Africa
MEA
false
2
1
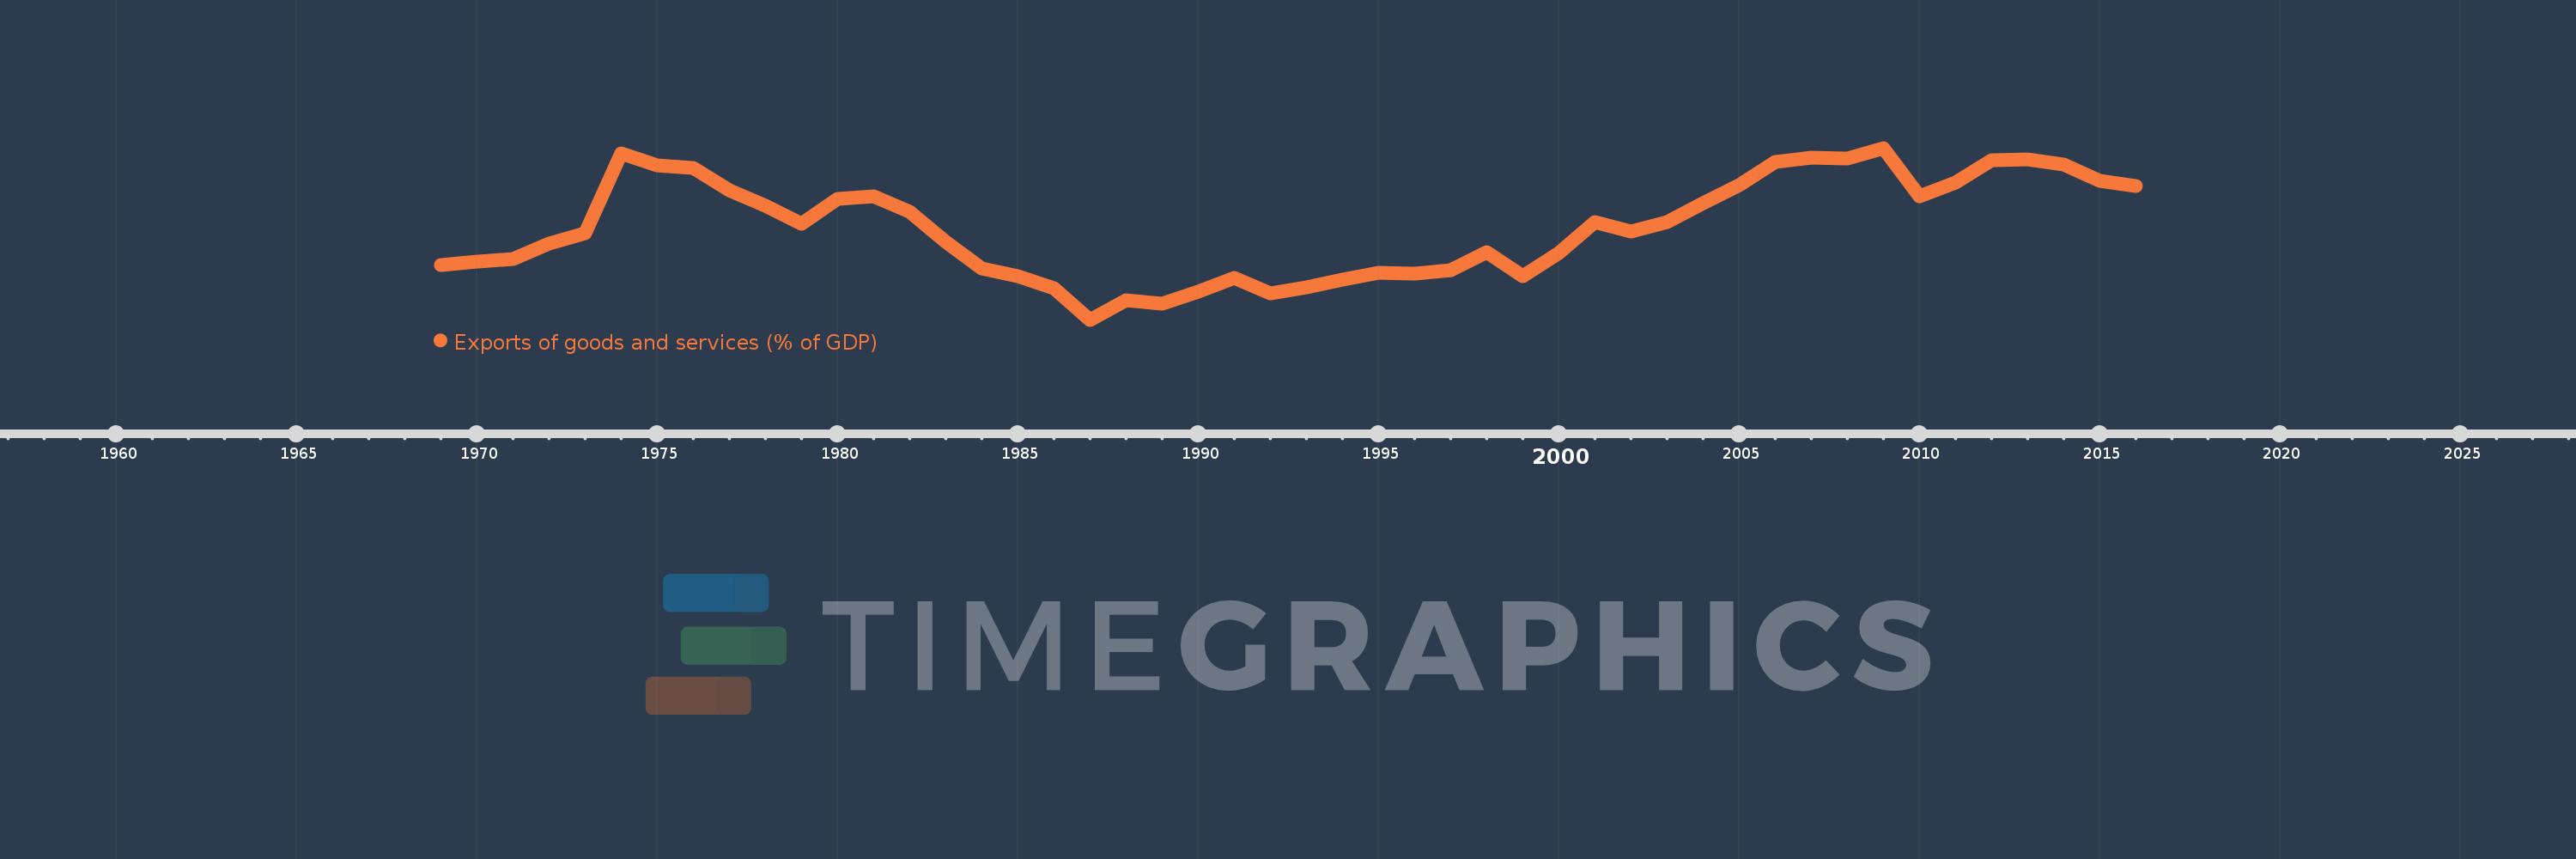
Exports of goods and services (% of GDP)
2016,2015,2014,2013,2012,2011,2010,2009,2008,2007,2006,2005,2004,2003,2002,2001,2000,1999,1998,1997,1996,1995,1994,1993,1992,1991,1990,1989,1988,1987,1986,1985,1984,1983,1982,1981,1980,1979,1978,1977,1976,1975,1974,1973,1972,1971,1970,1969
This statistics in other country:
AfghanistanAlbaniaAlgeriaAngolaAntigua and BarbudaArab WorldArgentinaArmeniaArubaAustraliaAustriaAzerbaijanBahamas, TheBahrainBangladeshBarbadosBelarusBelgiumBelizeBeninBermudaBhutanBoliviaBosnia and HerzegovinaBotswanaBrazilBrunei DarussalamBulgariaBurkina FasoBurundiCabo VerdeCambodiaCameroonCanadaCaribbean small statesCentral African RepublicCentral Europe and the BalticsChadChileChinaColombiaComorosCongo, Dem. Rep.Congo, Rep.Costa RicaCote d'IvoireCroatiaCubaCyprusCzech RepublicDenmarkDjiboutiDominicaDominican RepublicEarly-demographic dividendEast Asia & PacificEast Asia & Pacific (excluding high income)East Asia & Pacific (IDA & IBRD countries)EcuadorEgypt, Arab Rep.El SalvadorEquatorial GuineaEritreaEstoniaEthiopiaEuro areaEurope & Central AsiaEurope & Central Asia (excluding high income)Europe & Central Asia (IDA & IBRD countries)European UnionFaroe IslandsFijiFinlandFragile and conflict affected situationsFranceFrench PolynesiaGabonGambia, TheGeorgiaGermanyGhanaGreeceGrenadaGuatemalaGuineaGuinea-BissauGuyanaHaitiHeavily indebted poor countries (HIPC)High incomeHondurasHong Kong SAR, ChinaHungaryIBRD onlyIcelandIDA & IBRD totalIDA blendIDA onlyIDA totalIndiaIndonesiaIran, Islamic Rep.IraqIrelandIsraelItalyJamaicaJapanJordanKazakhstanKenyaKiribatiKorea, Rep.KosovoKuwaitKyrgyz RepublicLao PDRLate-demographic dividendLatin America & Caribbean Latin America & Caribbean (excluding high income)Latin America & the Caribbean (IDA & IBRD countries)LatviaLeast developed countries: UN classificationLebanonLesothoLiberiaLibyaLithuaniaLow & middle incomeLow incomeLower middle incomeLuxembourgMacao SAR, ChinaMacedonia, FYRMadagascarMalawiMalaysiaMaldivesMaliMaltaMauritaniaMauritiusMexicoMicronesia, Fed. Sts.Middle East & North AfricaMiddle East & North Africa (excluding high income)Middle East & North Africa (IDA & IBRD countries)Middle incomeMoldovaMongoliaMontenegroMoroccoMozambiqueMyanmarNamibiaNepalNetherlandsNew CaledoniaNew ZealandNicaraguaNigerNigeriaNorth AmericaNorwayOECD membersOmanOther small statesPacific island small statesPakistanPalauPanamaPapua New GuineaParaguayPeruPhilippinesPolandPortugalPost-demographic dividendPre-demographic dividendPuerto RicoQatarRomaniaRussian FederationRwandaSamoaSaudi ArabiaSenegalSerbiaSeychellesSierra LeoneSingaporeSlovak RepublicSloveniaSmall statesSolomon IslandsSomaliaSouth AfricaSouth AsiaSouth Asia (IDA & IBRD)South SudanSpainSri LankaSt. Kitts and NevisSt. LuciaSt. Vincent and the GrenadinesSub-Saharan Africa Sub-Saharan Africa (excluding high income)Sub-Saharan Africa (IDA & IBRD countries)SudanSurinameSwazilandSwedenSwitzerlandSyrian Arab RepublicTajikistanTanzaniaThailandTimor-LesteTogoTongaTrinidad and TobagoTunisiaTurkeyTurkmenistanUgandaUkraineUnited Arab EmiratesUnited KingdomUnited StatesUpper middle incomeUruguayUzbekistanVanuatuVenezuela, RBVietnamWest Bank and GazaWorldYemen, Rep.ZambiaZimbabwe Timeline:
This timeline shows a graph from 1969 to 2016 of Middle East & North Africa. No data until 1968. Number of actual observations by date: 48.
Source name:
World Development Indicators
Source organization:
World Bank national accounts data, and OECD National Accounts data files.
Categories, topics:
Economy & Growth, Trade
Last updated:
apr 23, 2017
Indicators value changes by year
Minimum:
22.345
jan 1, 1987
Maximum:
51.335
jan 1, 2009
At the date of observation
Value
Absolute change
Change from previous value
jan 1, 1969
31.548
+31.548
0.0%
jan 1, 1970
32.131
+0.583
1.85%
jan 1, 1971
32.643
+0.512
1.59%
jan 1, 1972
35.167
+2.525
7.73%
jan 1, 1973
36.886
+1.718
4.89%
jan 1, 1974
50.359
+13.474
36.53%
jan 1, 1975
48.333
-2.026
-4.02%
jan 1, 1976
47.957
-0.377
-0.78%
jan 1, 1977
44.219
-3.738
-7.79%
jan 1, 1978
41.621
-2.598
-5.88%
jan 1, 1979
38.465
-3.155
-7.58%
jan 1, 1980
42.74
+4.274
11.11%
jan 1, 1981
43.24
+0.501
1.17%
jan 1, 1982
40.595
-2.645
-6.12%
jan 1, 1983
35.512
-5.083
-12.52%
jan 1, 1984
31.01
-4.502
-12.68%
jan 1, 1985
29.622
-1.388
-4.48%
jan 1, 1986
27.679
-1.943
-6.56%
jan 1, 1987
22.345
-5.334
-19.27%
jan 1, 1988
25.705
+3.36
15.04%
jan 1, 1989
25.126
-0.579
-2.25%
jan 1, 1990
27.043
+1.917
7.63%
jan 1, 1991
29.435
+2.392
8.85%
jan 1, 1992
26.738
-2.698
-9.17%
jan 1, 1993
27.751
+1.013
3.79%
jan 1, 1994
29.106
+1.355
4.88%
jan 1, 1995
30.299
+1.193
4.1%
jan 1, 1996
30.074
-0.224
-0.74%
jan 1, 1997
30.704
+0.63
2.09%
jan 1, 1998
33.724
+3.02
9.83%
jan 1, 1999
29.73
-3.995
-11.84%
jan 1, 2000
33.674
+3.944
13.27%
jan 1, 2001
38.893
+5.22
15.5%
jan 1, 2002
37.3
-1.593
-4.1%
jan 1, 2003
38.862
+1.562
4.19%
jan 1, 2004
42.069
+3.207
8.25%
jan 1, 2005
45.082
+3.013
7.16%
jan 1, 2006
48.949
+3.867
8.58%
jan 1, 2007
49.757
+0.808
1.65%
jan 1, 2008
49.497
-0.26
-0.52%
jan 1, 2009
51.335
+1.838
3.71%
jan 1, 2010
43.128
-8.208
-15.99%
jan 1, 2011
45.433
+2.305
5.35%
jan 1, 2012
49.301
+3.868
8.51%
jan 1, 2013
49.336
+0.035
0.07%
jan 1, 2014
48.509
-0.827
-1.68%
jan 1, 2015
45.777
-2.731
-5.63%
jan 1, 2016
44.921
-0.856
-1.87%
Ranking of countries by current statistics by years


Comments: