29
/
en
AIzaSyAYiBZKx7MnpbEhh9jyipgxe19OcubqV5w
April 1, 2024
199066
Mongolia
MNG
true
2
1
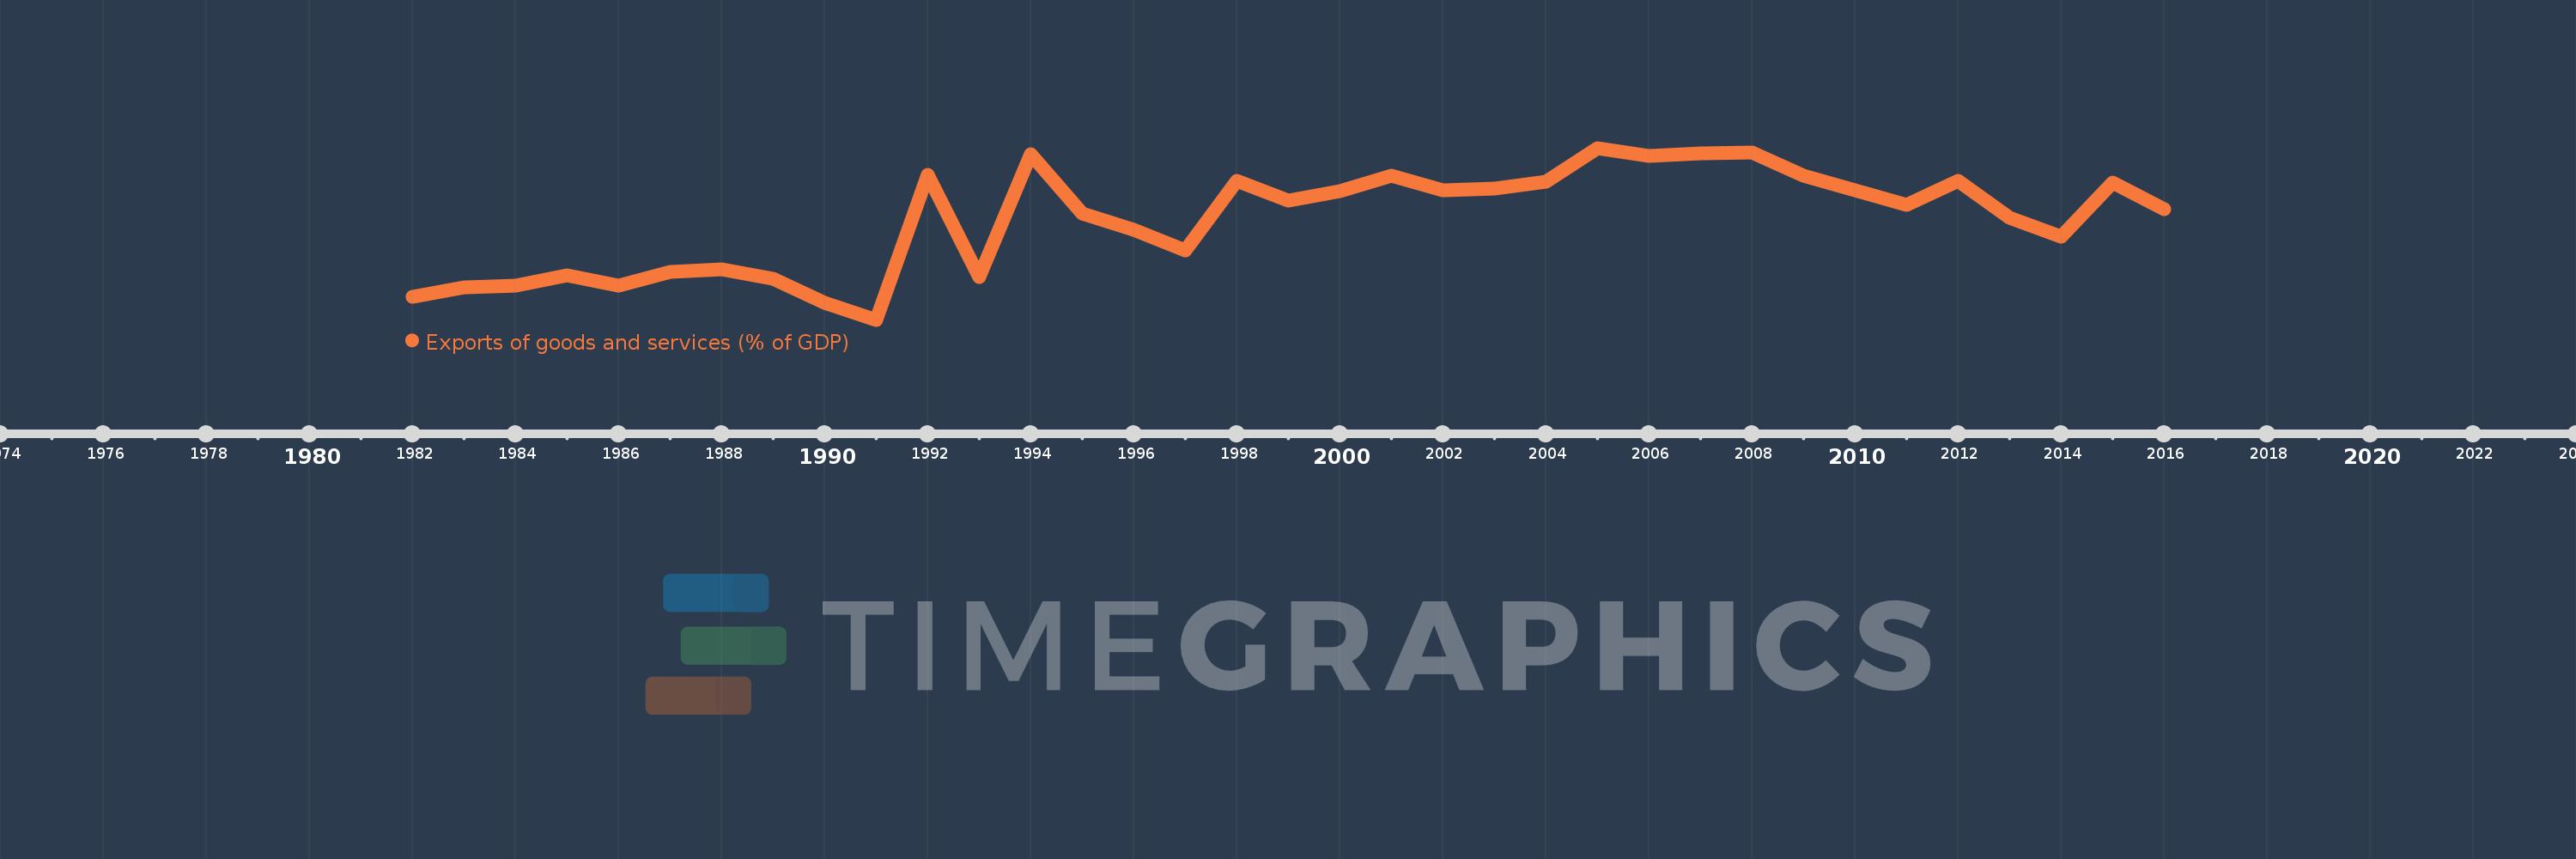
Exports of goods and services (% of GDP)
2016,2015,2014,2013,2012,2011,2010,2009,2008,2007,2006,2005,2004,2003,2002,2001,2000,1999,1998,1997,1996,1995,1994,1993,1992,1991,1990,1989,1988,1987,1986,1985,1984,1983,1982
This statistics in other country:
AfghanistanAlbaniaAlgeriaAngolaAntigua and BarbudaArab WorldArgentinaArmeniaArubaAustraliaAustriaAzerbaijanBahamas, TheBahrainBangladeshBarbadosBelarusBelgiumBelizeBeninBermudaBhutanBoliviaBosnia and HerzegovinaBotswanaBrazilBrunei DarussalamBulgariaBurkina FasoBurundiCabo VerdeCambodiaCameroonCanadaCaribbean small statesCentral African RepublicCentral Europe and the BalticsChadChileChinaColombiaComorosCongo, Dem. Rep.Congo, Rep.Costa RicaCote d'IvoireCroatiaCubaCyprusCzech RepublicDenmarkDjiboutiDominicaDominican RepublicEarly-demographic dividendEast Asia & PacificEast Asia & Pacific (excluding high income)East Asia & Pacific (IDA & IBRD countries)EcuadorEgypt, Arab Rep.El SalvadorEquatorial GuineaEritreaEstoniaEthiopiaEuro areaEurope & Central AsiaEurope & Central Asia (excluding high income)Europe & Central Asia (IDA & IBRD countries)European UnionFaroe IslandsFijiFinlandFragile and conflict affected situationsFranceFrench PolynesiaGabonGambia, TheGeorgiaGermanyGhanaGreeceGrenadaGuatemalaGuineaGuinea-BissauGuyanaHaitiHeavily indebted poor countries (HIPC)High incomeHondurasHong Kong SAR, ChinaHungaryIBRD onlyIcelandIDA & IBRD totalIDA blendIDA onlyIDA totalIndiaIndonesiaIran, Islamic Rep.IraqIrelandIsraelItalyJamaicaJapanJordanKazakhstanKenyaKiribatiKorea, Rep.KosovoKuwaitKyrgyz RepublicLao PDRLate-demographic dividendLatin America & Caribbean Latin America & Caribbean (excluding high income)Latin America & the Caribbean (IDA & IBRD countries)LatviaLeast developed countries: UN classificationLebanonLesothoLiberiaLibyaLithuaniaLow & middle incomeLow incomeLower middle incomeLuxembourgMacao SAR, ChinaMacedonia, FYRMadagascarMalawiMalaysiaMaldivesMaliMaltaMauritaniaMauritiusMexicoMicronesia, Fed. Sts.Middle East & North AfricaMiddle East & North Africa (excluding high income)Middle East & North Africa (IDA & IBRD countries)Middle incomeMoldovaMongoliaMontenegroMoroccoMozambiqueMyanmarNamibiaNepalNetherlandsNew CaledoniaNew ZealandNicaraguaNigerNigeriaNorth AmericaNorwayOECD membersOmanOther small statesPacific island small statesPakistanPalauPanamaPapua New GuineaParaguayPeruPhilippinesPolandPortugalPost-demographic dividendPre-demographic dividendPuerto RicoQatarRomaniaRussian FederationRwandaSamoaSaudi ArabiaSenegalSerbiaSeychellesSierra LeoneSingaporeSlovak RepublicSloveniaSmall statesSolomon IslandsSomaliaSouth AfricaSouth AsiaSouth Asia (IDA & IBRD)South SudanSpainSri LankaSt. Kitts and NevisSt. LuciaSt. Vincent and the GrenadinesSub-Saharan Africa Sub-Saharan Africa (excluding high income)Sub-Saharan Africa (IDA & IBRD countries)SudanSurinameSwazilandSwedenSwitzerlandSyrian Arab RepublicTajikistanTanzaniaThailandTimor-LesteTogoTongaTrinidad and TobagoTunisiaTurkeyTurkmenistanUgandaUkraineUnited Arab EmiratesUnited KingdomUnited StatesUpper middle incomeUruguayUzbekistanVanuatuVenezuela, RBVietnamWest Bank and GazaWorldYemen, Rep.ZambiaZimbabwe Timeline:
This timeline shows a graph from 1982 to 2016 of Mongolia. No data until 1981. Number of actual observations by date: 35.
Source name:
World Development Indicators
Source organization:
World Bank national accounts data, and OECD National Accounts data files.
Categories, topics:
Economy & Growth, Trade
Last updated:
apr 23, 2017
Indicators value changes by year
Minimum:
18.275
jan 1, 1991
Maximum:
60.788
jan 1, 2005
At the date of observation
Value
Absolute change
Change from previous value
jan 1, 1982
23.871
+23.871
0.0%
jan 1, 1983
26.259
+2.388
10.0%
jan 1, 1984
26.608
+0.349
1.33%
jan 1, 1985
29.18
+2.571
9.66%
jan 1, 1986
26.73
-2.45
-8.4%
jan 1, 1987
30.178
+3.448
12.9%
jan 1, 1988
30.803
+0.625
2.07%
jan 1, 1989
28.449
-2.354
-7.64%
jan 1, 1990
22.487
-5.962
-20.96%
jan 1, 1991
18.275
-4.212
-18.73%
jan 1, 1992
54.068
+35.794
195.87%
jan 1, 1993
28.933
-25.135
-46.49%
jan 1, 1994
59.332
+30.399
105.07%
jan 1, 1995
44.631
-14.701
-24.78%
jan 1, 1996
40.541
-4.089
-9.16%
jan 1, 1997
35.524
-5.017
-12.38%
jan 1, 1998
52.666
+17.142
48.25%
jan 1, 1999
47.844
-4.823
-9.16%
jan 1, 2000
50.158
+2.315
4.84%
jan 1, 2001
53.997
+3.838
7.65%
jan 1, 2002
50.318
-3.678
-6.81%
jan 1, 2003
50.727
+0.408
0.81%
jan 1, 2004
52.352
+1.625
3.2%
jan 1, 2005
60.788
+8.436
16.11%
jan 1, 2006
58.769
-2.018
-3.32%
jan 1, 2007
59.443
+0.674
1.15%
jan 1, 2008
59.614
+0.171
0.29%
jan 1, 2009
54.017
-5.597
-9.39%
jan 1, 2010
50.278
-3.739
-6.92%
jan 1, 2011
46.679
-3.599
-7.16%
jan 1, 2012
52.554
+5.875
12.59%
jan 1, 2013
43.572
-8.981
-17.09%
jan 1, 2014
38.89
-4.682
-10.75%
jan 1, 2015
52.249
+13.359
34.35%
jan 1, 2016
45.678
-6.571
-12.58%
Ranking of countries by current statistics by years


Comments: