29
/
en
AIzaSyAYiBZKx7MnpbEhh9jyipgxe19OcubqV5w
April 1, 2024
238205
Seychelles
SYC
true
2
1
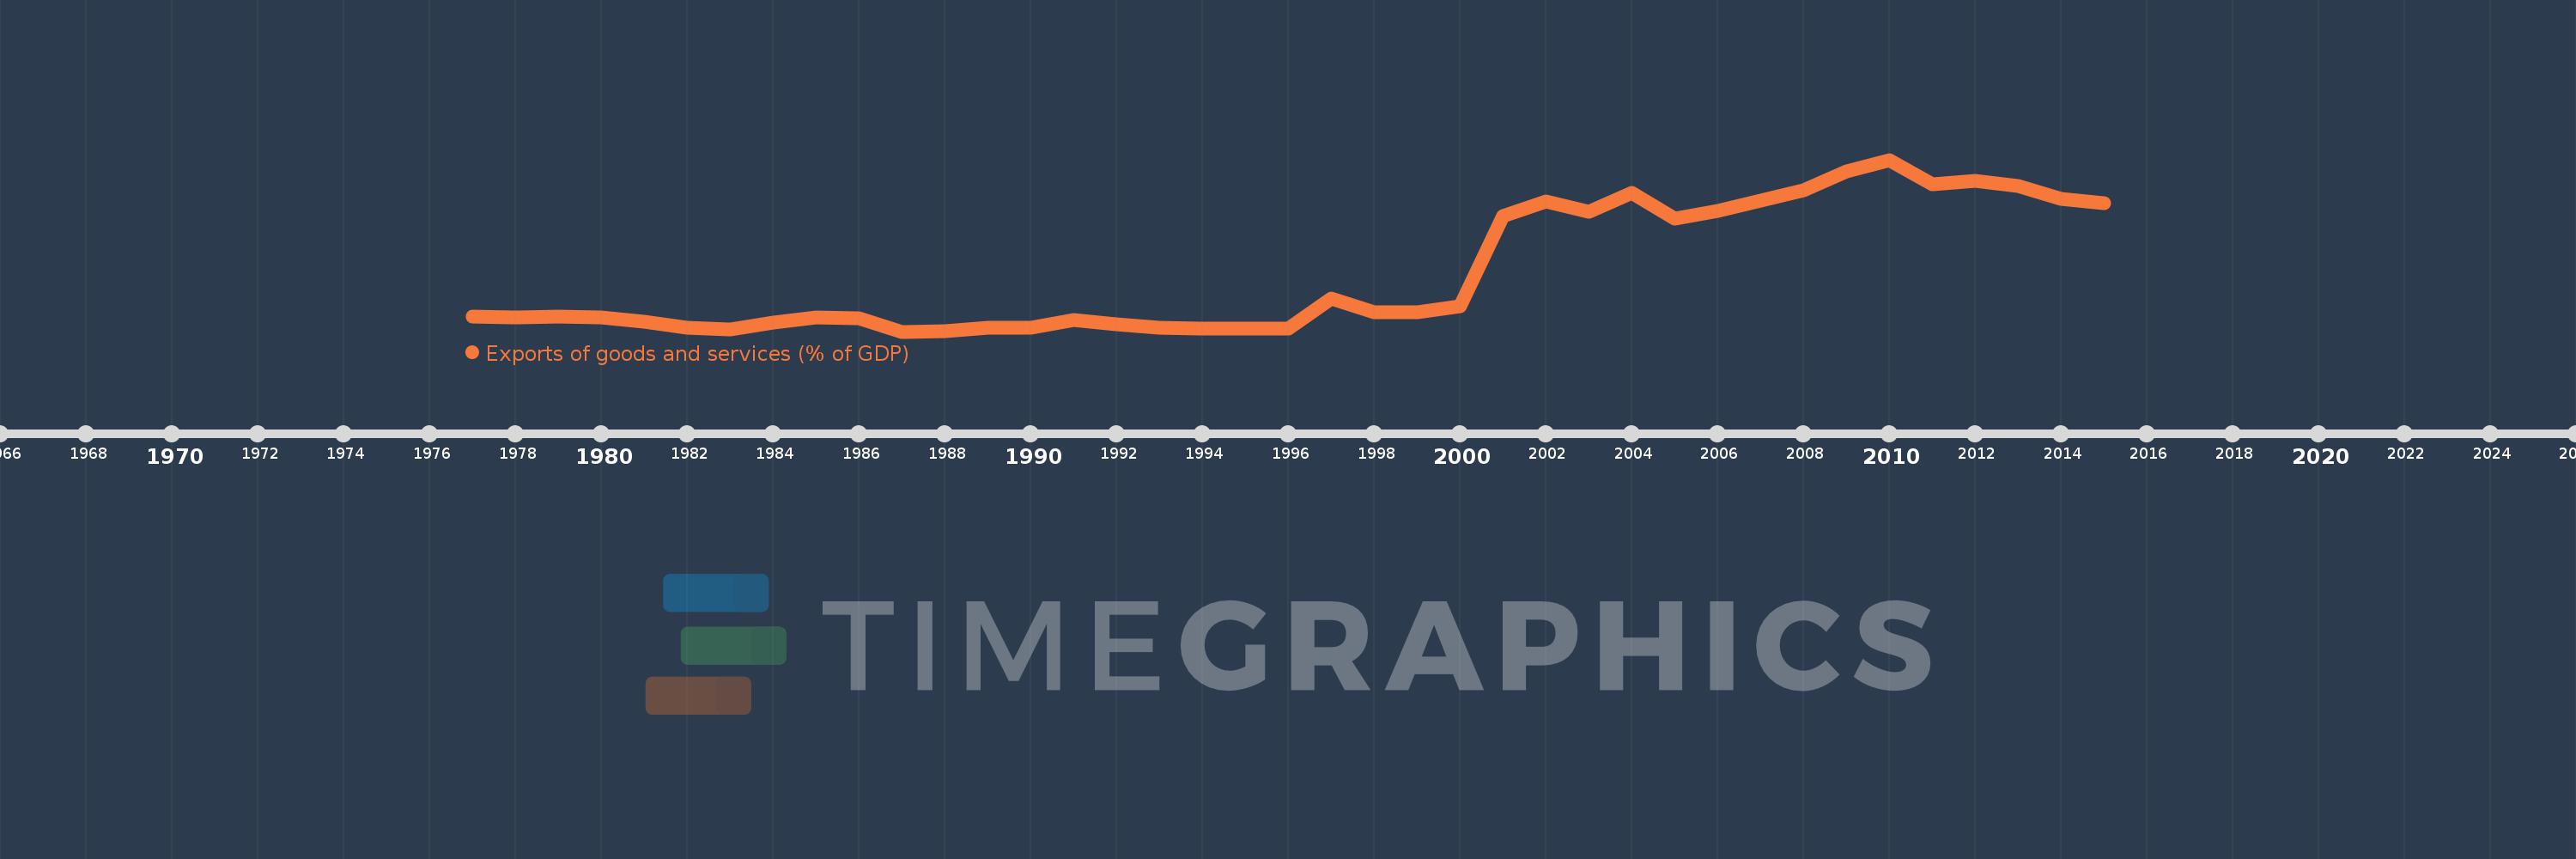
Exports of goods and services (% of GDP)
2015,2014,2013,2012,2011,2010,2009,2008,2007,2006,2005,2004,2003,2002,2001,2000,1999,1998,1997,1996,1995,1994,1993,1992,1991,1990,1989,1988,1987,1986,1985,1984,1983,1982,1981,1980,1979,1978,1977
This statistics in other country:
AfghanistanAlbaniaAlgeriaAngolaAntigua and BarbudaArab WorldArgentinaArmeniaArubaAustraliaAustriaAzerbaijanBahamas, TheBahrainBangladeshBarbadosBelarusBelgiumBelizeBeninBermudaBhutanBoliviaBosnia and HerzegovinaBotswanaBrazilBrunei DarussalamBulgariaBurkina FasoBurundiCabo VerdeCambodiaCameroonCanadaCaribbean small statesCentral African RepublicCentral Europe and the BalticsChadChileChinaColombiaComorosCongo, Dem. Rep.Congo, Rep.Costa RicaCote d'IvoireCroatiaCubaCyprusCzech RepublicDenmarkDjiboutiDominicaDominican RepublicEarly-demographic dividendEast Asia & PacificEast Asia & Pacific (excluding high income)East Asia & Pacific (IDA & IBRD countries)EcuadorEgypt, Arab Rep.El SalvadorEquatorial GuineaEritreaEstoniaEthiopiaEuro areaEurope & Central AsiaEurope & Central Asia (excluding high income)Europe & Central Asia (IDA & IBRD countries)European UnionFaroe IslandsFijiFinlandFragile and conflict affected situationsFranceFrench PolynesiaGabonGambia, TheGeorgiaGermanyGhanaGreeceGrenadaGuatemalaGuineaGuinea-BissauGuyanaHaitiHeavily indebted poor countries (HIPC)High incomeHondurasHong Kong SAR, ChinaHungaryIBRD onlyIcelandIDA & IBRD totalIDA blendIDA onlyIDA totalIndiaIndonesiaIran, Islamic Rep.IraqIrelandIsraelItalyJamaicaJapanJordanKazakhstanKenyaKiribatiKorea, Rep.KosovoKuwaitKyrgyz RepublicLao PDRLate-demographic dividendLatin America & Caribbean Latin America & Caribbean (excluding high income)Latin America & the Caribbean (IDA & IBRD countries)LatviaLeast developed countries: UN classificationLebanonLesothoLiberiaLibyaLithuaniaLow & middle incomeLow incomeLower middle incomeLuxembourgMacao SAR, ChinaMacedonia, FYRMadagascarMalawiMalaysiaMaldivesMaliMaltaMauritaniaMauritiusMexicoMicronesia, Fed. Sts.Middle East & North AfricaMiddle East & North Africa (excluding high income)Middle East & North Africa (IDA & IBRD countries)Middle incomeMoldovaMongoliaMontenegroMoroccoMozambiqueMyanmarNamibiaNepalNetherlandsNew CaledoniaNew ZealandNicaraguaNigerNigeriaNorth AmericaNorwayOECD membersOmanOther small statesPacific island small statesPakistanPalauPanamaPapua New GuineaParaguayPeruPhilippinesPolandPortugalPost-demographic dividendPre-demographic dividendPuerto RicoQatarRomaniaRussian FederationRwandaSamoaSaudi ArabiaSenegalSerbiaSeychellesSierra LeoneSingaporeSlovak RepublicSloveniaSmall statesSolomon IslandsSomaliaSouth AfricaSouth AsiaSouth Asia (IDA & IBRD)South SudanSpainSri LankaSt. Kitts and NevisSt. LuciaSt. Vincent and the GrenadinesSub-Saharan Africa Sub-Saharan Africa (excluding high income)Sub-Saharan Africa (IDA & IBRD countries)SudanSurinameSwazilandSwedenSwitzerlandSyrian Arab RepublicTajikistanTanzaniaThailandTimor-LesteTogoTongaTrinidad and TobagoTunisiaTurkeyTurkmenistanUgandaUkraineUnited Arab EmiratesUnited KingdomUnited StatesUpper middle incomeUruguayUzbekistanVanuatuVenezuela, RBVietnamWest Bank and GazaWorldYemen, Rep.ZambiaZimbabwe Timeline:
This timeline shows a graph from 1977 to 2015 of Seychelles. No data until 1976. Number of actual observations by date: 39.
Source name:
World Development Indicators
Source organization:
World Bank national accounts data, and OECD National Accounts data files.
Categories, topics:
Economy & Growth, Trade
Last updated:
apr 23, 2017
Indicators value changes by year
Maximum:
107.994
jan 1, 2010
At the date of observation
Value
Absolute change
Change from previous value
jan 1, 1977
17.6
+17.6
0.0%
jan 1, 1978
17.185
-0.414
-2.36%
jan 1, 1979
17.725
+0.54
3.14%
jan 1, 1980
17.201
-0.524
-2.96%
jan 1, 1981
14.355
-2.846
-16.55%
jan 1, 1982
11.075
-3.28
-22.85%
jan 1, 1983
10.326
-0.749
-6.76%
jan 1, 1984
13.823
+3.496
33.86%
jan 1, 1985
16.99
+3.167
22.91%
jan 1, 1986
16.573
-0.417
-2.45%
jan 1, 1987
8.852
-7.721
-46.59%
jan 1, 1988
8.888
+0.036
0.41%
jan 1, 1989
11.212
+2.324
26.14%
jan 1, 1990
11.245
+0.032
0.29%
jan 1, 1991
15.327
+4.083
36.31%
jan 1, 1992
13.043
-2.284
-14.9%
jan 1, 1993
11.06
-1.983
-15.21%
jan 1, 1994
10.793
-0.267
-2.42%
jan 1, 1995
10.396
-0.397
-3.68%
jan 1, 1996
10.475
+0.079
0.76%
jan 1, 1997
27.735
+17.26
164.77%
jan 1, 1998
20.117
-7.618
-27.47%
jan 1, 1999
20.106
-0.011
-0.05%
jan 1, 2000
23.289
+3.182
15.83%
jan 1, 2001
75.473
+52.184
224.07%
jan 1, 2002
83.791
+8.318
11.02%
jan 1, 2003
77.866
-5.925
-7.07%
jan 1, 2004
88.884
+11.017
14.15%
jan 1, 2005
74.01
-14.874
-16.73%
jan 1, 2006
78.301
+4.291
5.8%
jan 1, 2007
84.367
+6.066
7.75%
jan 1, 2008
90.626
+6.258
7.42%
jan 1, 2009
101.393
+10.767
11.88%
jan 1, 2010
107.994
+6.602
6.51%
jan 1, 2011
93.799
-14.196
-13.14%
jan 1, 2012
95.769
+1.97
2.1%
jan 1, 2013
92.783
-2.986
-3.12%
jan 1, 2014
85.474
-7.31
-7.88%
jan 1, 2015
83.094
-2.379
-2.78%
Ranking of countries by current statistics by years


Comments: