29
/
en
AIzaSyAYiBZKx7MnpbEhh9jyipgxe19OcubqV5w
April 1, 2024
45027
Low & middle income
LMY
false
2
1
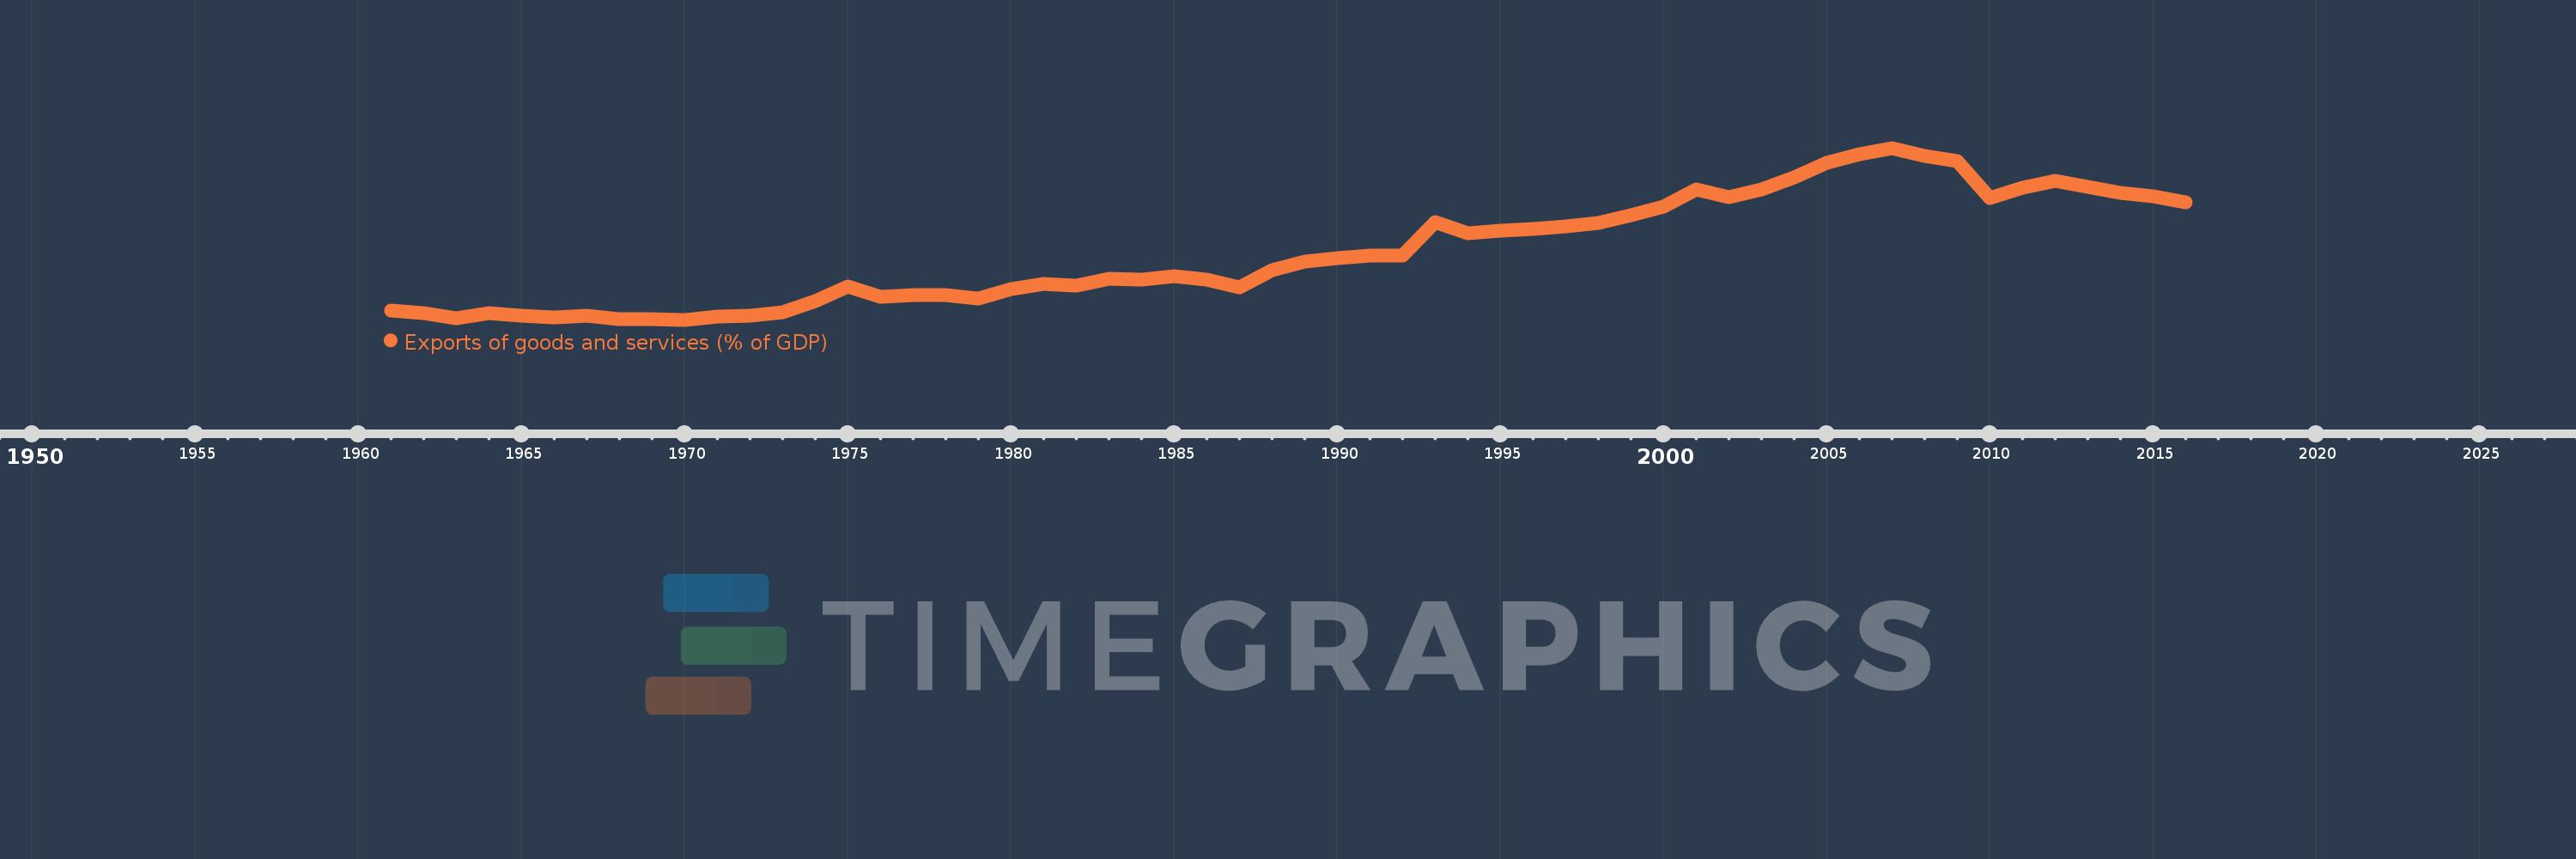
Exports of goods and services (% of GDP)
2016,2015,2014,2013,2012,2011,2010,2009,2008,2007,2006,2005,2004,2003,2002,2001,2000,1999,1998,1997,1996,1995,1994,1993,1992,1991,1990,1989,1988,1987,1986,1985,1984,1983,1982,1981,1980,1979,1978,1977,1976,1975,1974,1973,1972,1971,1970,1969,1968,1967,1966,1965,1964,1963,1962,1961
This statistics in other country:
AfghanistanAlbaniaAlgeriaAngolaAntigua and BarbudaArab WorldArgentinaArmeniaArubaAustraliaAustriaAzerbaijanBahamas, TheBahrainBangladeshBarbadosBelarusBelgiumBelizeBeninBermudaBhutanBoliviaBosnia and HerzegovinaBotswanaBrazilBrunei DarussalamBulgariaBurkina FasoBurundiCabo VerdeCambodiaCameroonCanadaCaribbean small statesCentral African RepublicCentral Europe and the BalticsChadChileChinaColombiaComorosCongo, Dem. Rep.Congo, Rep.Costa RicaCote d'IvoireCroatiaCubaCyprusCzech RepublicDenmarkDjiboutiDominicaDominican RepublicEarly-demographic dividendEast Asia & PacificEast Asia & Pacific (excluding high income)East Asia & Pacific (IDA & IBRD countries)EcuadorEgypt, Arab Rep.El SalvadorEquatorial GuineaEritreaEstoniaEthiopiaEuro areaEurope & Central AsiaEurope & Central Asia (excluding high income)Europe & Central Asia (IDA & IBRD countries)European UnionFaroe IslandsFijiFinlandFragile and conflict affected situationsFranceFrench PolynesiaGabonGambia, TheGeorgiaGermanyGhanaGreeceGrenadaGuatemalaGuineaGuinea-BissauGuyanaHaitiHeavily indebted poor countries (HIPC)High incomeHondurasHong Kong SAR, ChinaHungaryIBRD onlyIcelandIDA & IBRD totalIDA blendIDA onlyIDA totalIndiaIndonesiaIran, Islamic Rep.IraqIrelandIsraelItalyJamaicaJapanJordanKazakhstanKenyaKiribatiKorea, Rep.KosovoKuwaitKyrgyz RepublicLao PDRLate-demographic dividendLatin America & Caribbean Latin America & Caribbean (excluding high income)Latin America & the Caribbean (IDA & IBRD countries)LatviaLeast developed countries: UN classificationLebanonLesothoLiberiaLibyaLithuaniaLow & middle incomeLow incomeLower middle incomeLuxembourgMacao SAR, ChinaMacedonia, FYRMadagascarMalawiMalaysiaMaldivesMaliMaltaMauritaniaMauritiusMexicoMicronesia, Fed. Sts.Middle East & North AfricaMiddle East & North Africa (excluding high income)Middle East & North Africa (IDA & IBRD countries)Middle incomeMoldovaMongoliaMontenegroMoroccoMozambiqueMyanmarNamibiaNepalNetherlandsNew CaledoniaNew ZealandNicaraguaNigerNigeriaNorth AmericaNorwayOECD membersOmanOther small statesPacific island small statesPakistanPalauPanamaPapua New GuineaParaguayPeruPhilippinesPolandPortugalPost-demographic dividendPre-demographic dividendPuerto RicoQatarRomaniaRussian FederationRwandaSamoaSaudi ArabiaSenegalSerbiaSeychellesSierra LeoneSingaporeSlovak RepublicSloveniaSmall statesSolomon IslandsSomaliaSouth AfricaSouth AsiaSouth Asia (IDA & IBRD)South SudanSpainSri LankaSt. Kitts and NevisSt. LuciaSt. Vincent and the GrenadinesSub-Saharan Africa Sub-Saharan Africa (excluding high income)Sub-Saharan Africa (IDA & IBRD countries)SudanSurinameSwazilandSwedenSwitzerlandSyrian Arab RepublicTajikistanTanzaniaThailandTimor-LesteTogoTongaTrinidad and TobagoTunisiaTurkeyTurkmenistanUgandaUkraineUnited Arab EmiratesUnited KingdomUnited StatesUpper middle incomeUruguayUzbekistanVanuatuVenezuela, RBVietnamWest Bank and GazaWorldYemen, Rep.ZambiaZimbabwe Timeline:
This timeline shows a graph from 1961 to 2016 of Low & middle income. No data until 1960. Number of actual observations by date: 56.
Source name:
World Development Indicators
Source organization:
World Bank national accounts data, and OECD National Accounts data files.
Categories, topics:
Economy & Growth, Trade
Last updated:
apr 23, 2017
Indicators value changes by year
Maximum:
33.006
jan 1, 2007
At the date of observation
Value
Absolute change
Change from previous value
jan 1, 1961
9.671
+9.671
0.0%
jan 1, 1962
9.404
-0.267
-2.76%
jan 1, 1963
8.592
-0.812
-8.63%
jan 1, 1964
9.344
+0.752
8.75%
jan 1, 1965
8.926
-0.417
-4.47%
jan 1, 1966
8.725
-0.201
-2.25%
jan 1, 1967
8.962
+0.237
2.72%
jan 1, 1968
8.464
-0.499
-5.57%
jan 1, 1969
8.529
+0.065
0.77%
jan 1, 1970
8.399
-0.13
-1.52%
jan 1, 1971
8.799
+0.4
4.77%
jan 1, 1972
8.968
+0.169
1.92%
jan 1, 1973
9.526
+0.558
6.22%
jan 1, 1974
11.1
+1.574
16.52%
jan 1, 1975
13.176
+2.076
18.7%
jan 1, 1976
11.729
-1.447
-10.98%
jan 1, 1977
11.981
+0.253
2.15%
jan 1, 1978
11.932
-0.05
-0.41%
jan 1, 1979
11.424
-0.508
-4.26%
jan 1, 1980
12.849
+1.425
12.48%
jan 1, 1981
13.564
+0.715
5.57%
jan 1, 1982
13.316
-0.248
-1.83%
jan 1, 1983
14.246
+0.931
6.99%
jan 1, 1984
14.181
-0.065
-0.46%
jan 1, 1985
14.648
+0.466
3.29%
jan 1, 1986
14.17
-0.478
-3.26%
jan 1, 1987
13.055
-1.115
-7.87%
jan 1, 1988
15.513
+2.458
18.83%
jan 1, 1989
16.754
+1.241
8.0%
jan 1, 1990
17.185
+0.43
2.57%
jan 1, 1991
17.599
+0.415
2.41%
jan 1, 1992
17.647
+0.047
0.27%
jan 1, 1993
22.438
+4.792
27.15%
jan 1, 1994
20.791
-1.648
-7.34%
jan 1, 1995
21.119
+0.328
1.58%
jan 1, 1996
21.438
+0.319
1.51%
jan 1, 1997
21.722
+0.284
1.33%
jan 1, 1998
22.316
+0.594
2.74%
jan 1, 1999
23.341
+1.024
4.59%
jan 1, 2000
24.626
+1.285
5.51%
jan 1, 2001
27.062
+2.436
9.89%
jan 1, 2002
25.922
-1.14
-4.21%
jan 1, 2003
27.061
+1.139
4.39%
jan 1, 2004
28.844
+1.783
6.59%
jan 1, 2005
30.858
+2.014
6.98%
jan 1, 2006
32.109
+1.251
4.05%
jan 1, 2007
33.006
+0.897
2.79%
jan 1, 2008
31.805
-1.202
-3.64%
jan 1, 2009
31.145
-0.66
-2.07%
jan 1, 2010
25.842
-5.303
-17.03%
jan 1, 2011
27.306
+1.463
5.66%
jan 1, 2012
28.325
+1.02
3.73%
jan 1, 2013
27.392
-0.933
-3.3%
jan 1, 2014
26.603
-0.789
-2.88%
jan 1, 2015
26.137
-0.466
-1.75%
jan 1, 2016
25.225
-0.912
-3.49%
Ranking of countries by current statistics by years


Comments: