29
/
en
AIzaSyAYiBZKx7MnpbEhh9jyipgxe19OcubqV5w
April 1, 2024
206678
Nepal
NPL
true
2
1
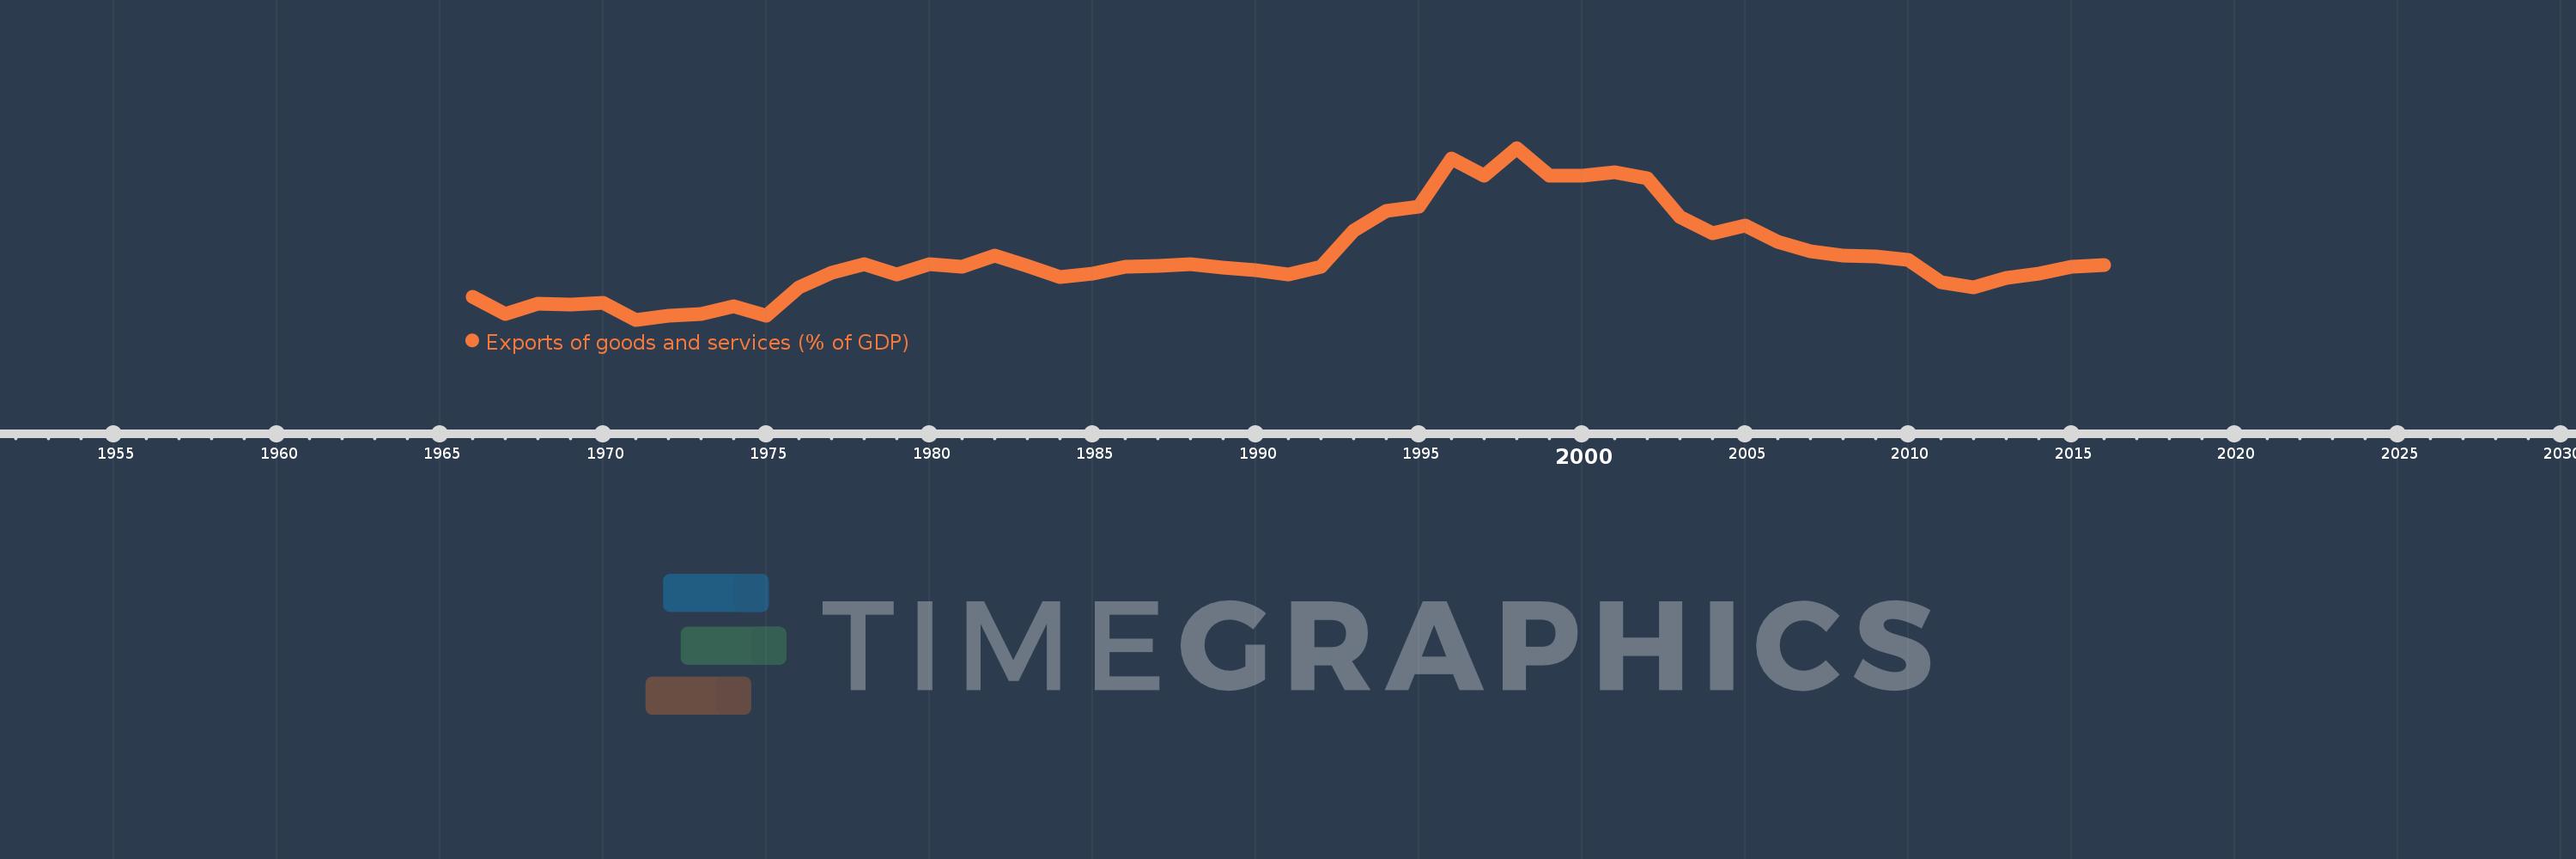
Exports of goods and services (% of GDP)
2016,2015,2014,2013,2012,2011,2010,2009,2008,2007,2006,2005,2004,2003,2002,2001,2000,1999,1998,1997,1996,1995,1994,1993,1992,1991,1990,1989,1988,1987,1986,1985,1984,1983,1982,1981,1980,1979,1978,1977,1976,1975,1974,1973,1972,1971,1970,1969,1968,1967,1966
This statistics in other country:
AfghanistanAlbaniaAlgeriaAngolaAntigua and BarbudaArab WorldArgentinaArmeniaArubaAustraliaAustriaAzerbaijanBahamas, TheBahrainBangladeshBarbadosBelarusBelgiumBelizeBeninBermudaBhutanBoliviaBosnia and HerzegovinaBotswanaBrazilBrunei DarussalamBulgariaBurkina FasoBurundiCabo VerdeCambodiaCameroonCanadaCaribbean small statesCentral African RepublicCentral Europe and the BalticsChadChileChinaColombiaComorosCongo, Dem. Rep.Congo, Rep.Costa RicaCote d'IvoireCroatiaCubaCyprusCzech RepublicDenmarkDjiboutiDominicaDominican RepublicEarly-demographic dividendEast Asia & PacificEast Asia & Pacific (excluding high income)East Asia & Pacific (IDA & IBRD countries)EcuadorEgypt, Arab Rep.El SalvadorEquatorial GuineaEritreaEstoniaEthiopiaEuro areaEurope & Central AsiaEurope & Central Asia (excluding high income)Europe & Central Asia (IDA & IBRD countries)European UnionFaroe IslandsFijiFinlandFragile and conflict affected situationsFranceFrench PolynesiaGabonGambia, TheGeorgiaGermanyGhanaGreeceGrenadaGuatemalaGuineaGuinea-BissauGuyanaHaitiHeavily indebted poor countries (HIPC)High incomeHondurasHong Kong SAR, ChinaHungaryIBRD onlyIcelandIDA & IBRD totalIDA blendIDA onlyIDA totalIndiaIndonesiaIran, Islamic Rep.IraqIrelandIsraelItalyJamaicaJapanJordanKazakhstanKenyaKiribatiKorea, Rep.KosovoKuwaitKyrgyz RepublicLao PDRLate-demographic dividendLatin America & Caribbean Latin America & Caribbean (excluding high income)Latin America & the Caribbean (IDA & IBRD countries)LatviaLeast developed countries: UN classificationLebanonLesothoLiberiaLibyaLithuaniaLow & middle incomeLow incomeLower middle incomeLuxembourgMacao SAR, ChinaMacedonia, FYRMadagascarMalawiMalaysiaMaldivesMaliMaltaMauritaniaMauritiusMexicoMicronesia, Fed. Sts.Middle East & North AfricaMiddle East & North Africa (excluding high income)Middle East & North Africa (IDA & IBRD countries)Middle incomeMoldovaMongoliaMontenegroMoroccoMozambiqueMyanmarNamibiaNepalNetherlandsNew CaledoniaNew ZealandNicaraguaNigerNigeriaNorth AmericaNorwayOECD membersOmanOther small statesPacific island small statesPakistanPalauPanamaPapua New GuineaParaguayPeruPhilippinesPolandPortugalPost-demographic dividendPre-demographic dividendPuerto RicoQatarRomaniaRussian FederationRwandaSamoaSaudi ArabiaSenegalSerbiaSeychellesSierra LeoneSingaporeSlovak RepublicSloveniaSmall statesSolomon IslandsSomaliaSouth AfricaSouth AsiaSouth Asia (IDA & IBRD)South SudanSpainSri LankaSt. Kitts and NevisSt. LuciaSt. Vincent and the GrenadinesSub-Saharan Africa Sub-Saharan Africa (excluding high income)Sub-Saharan Africa (IDA & IBRD countries)SudanSurinameSwazilandSwedenSwitzerlandSyrian Arab RepublicTajikistanTanzaniaThailandTimor-LesteTogoTongaTrinidad and TobagoTunisiaTurkeyTurkmenistanUgandaUkraineUnited Arab EmiratesUnited KingdomUnited StatesUpper middle incomeUruguayUzbekistanVanuatuVenezuela, RBVietnamWest Bank and GazaWorldYemen, Rep.ZambiaZimbabwe Timeline:
This timeline shows a graph from 1966 to 2016 of Nepal. No data until 1965. Number of actual observations by date: 51.
Source name:
World Development Indicators
Source organization:
World Bank national accounts data, and OECD National Accounts data files.
Categories, topics:
Economy & Growth, Trade
Last updated:
apr 23, 2017
Indicators value changes by year
Maximum:
26.328
jan 1, 1998
At the date of observation
Value
Absolute change
Change from previous value
jan 1, 1966
7.765
+7.765
0.0%
jan 1, 1967
5.645
-2.12
-27.31%
jan 1, 1968
6.875
+1.23
21.78%
jan 1, 1969
6.845
-0.029
-0.43%
jan 1, 1970
7.013
+0.168
2.45%
jan 1, 1971
4.904
-2.109
-30.07%
jan 1, 1972
5.404
+0.5
10.19%
jan 1, 1973
5.661
+0.257
4.76%
jan 1, 1974
6.61
+0.949
16.77%
jan 1, 1975
5.45
-1.161
-17.56%
jan 1, 1976
8.901
+3.451
63.33%
jan 1, 1977
10.774
+1.873
21.04%
jan 1, 1978
11.788
+1.014
9.42%
jan 1, 1979
10.572
-1.217
-10.32%
jan 1, 1980
11.785
+1.213
11.48%
jan 1, 1981
11.541
-0.244
-2.07%
jan 1, 1982
12.901
+1.36
11.79%
jan 1, 1983
11.592
-1.31
-10.15%
jan 1, 1984
10.231
-1.361
-11.74%
jan 1, 1985
10.652
+0.421
4.12%
jan 1, 1986
11.529
+0.877
8.23%
jan 1, 1987
11.662
+0.133
1.15%
jan 1, 1988
11.813
+0.151
1.29%
jan 1, 1989
11.447
-0.366
-3.1%
jan 1, 1990
11.068
-0.38
-3.32%
jan 1, 1991
10.527
-0.54
-4.88%
jan 1, 1992
11.491
+0.963
9.15%
jan 1, 1993
15.96
+4.469
38.89%
jan 1, 1994
18.433
+2.473
15.5%
jan 1, 1995
18.994
+0.561
3.04%
jan 1, 1996
24.973
+5.979
31.48%
jan 1, 1997
22.818
-2.156
-8.63%
jan 1, 1998
26.328
+3.51
15.38%
jan 1, 1999
22.822
-3.506
-13.32%
jan 1, 2000
22.848
+0.026
0.12%
jan 1, 2001
23.284
+0.436
1.91%
jan 1, 2002
22.561
-0.723
-3.11%
jan 1, 2003
17.737
-4.824
-21.38%
jan 1, 2004
15.7
-2.037
-11.49%
jan 1, 2005
16.683
+0.983
6.26%
jan 1, 2006
14.584
-2.099
-12.58%
jan 1, 2007
13.447
-1.137
-7.8%
jan 1, 2008
12.856
-0.591
-4.39%
jan 1, 2009
12.776
-0.08
-0.62%
jan 1, 2010
12.419
-0.356
-2.79%
jan 1, 2011
9.583
-2.837
-22.84%
jan 1, 2012
8.904
-0.679
-7.08%
jan 1, 2013
10.074
+1.17
13.14%
jan 1, 2014
10.689
+0.615
6.11%
jan 1, 2015
11.505
+0.816
7.63%
jan 1, 2016
11.675
+0.17
1.48%
Ranking of countries by current statistics by years


Comments: