29
/
en
AIzaSyAYiBZKx7MnpbEhh9jyipgxe19OcubqV5w
April 1, 2024
216348
Pakistan
PAK
true
2
1
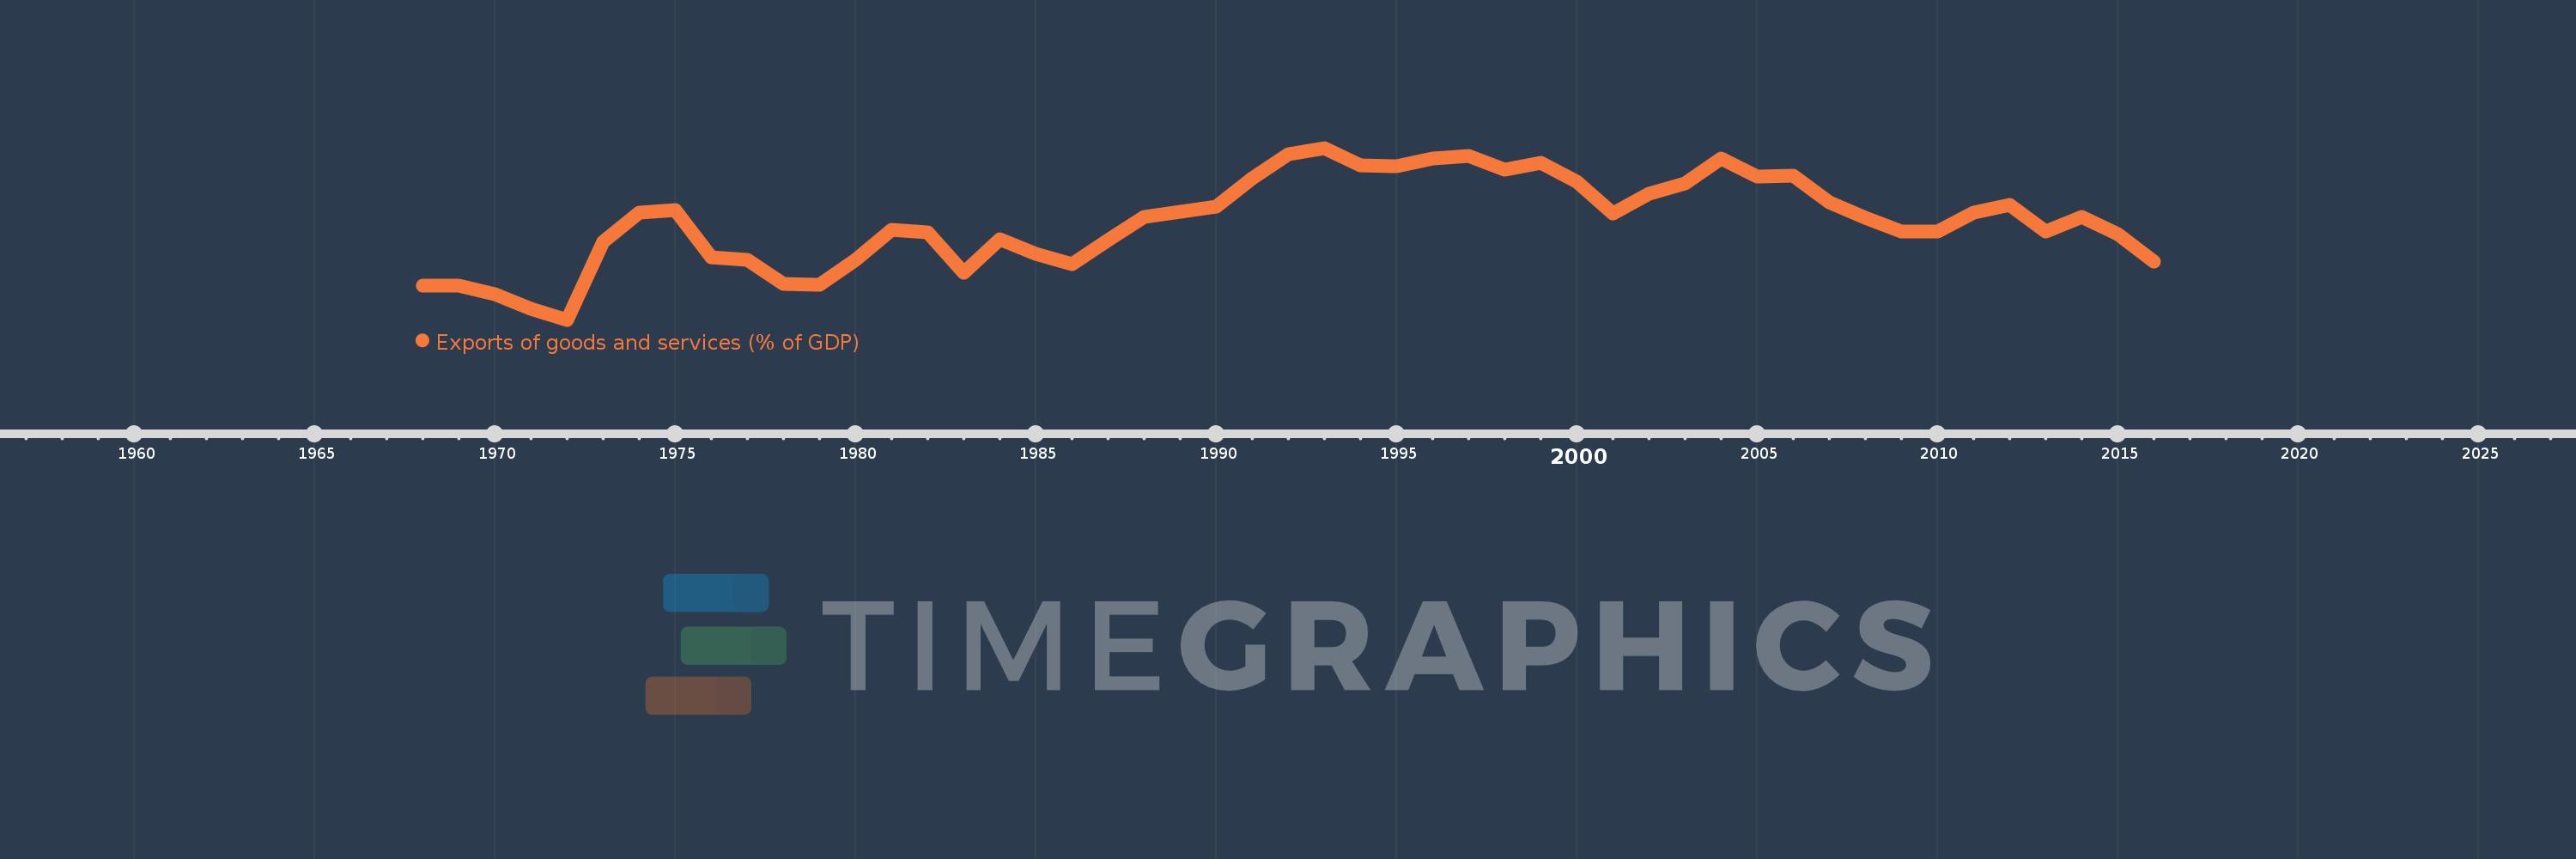
Exports of goods and services (% of GDP)
2016,2015,2014,2013,2012,2011,2010,2009,2008,2007,2006,2005,2004,2003,2002,2001,2000,1999,1998,1997,1996,1995,1994,1993,1992,1991,1990,1989,1988,1987,1986,1985,1984,1983,1982,1981,1980,1979,1978,1977,1976,1975,1974,1973,1972,1971,1970,1969,1968
This statistics in other country:
AfghanistanAlbaniaAlgeriaAngolaAntigua and BarbudaArab WorldArgentinaArmeniaArubaAustraliaAustriaAzerbaijanBahamas, TheBahrainBangladeshBarbadosBelarusBelgiumBelizeBeninBermudaBhutanBoliviaBosnia and HerzegovinaBotswanaBrazilBrunei DarussalamBulgariaBurkina FasoBurundiCabo VerdeCambodiaCameroonCanadaCaribbean small statesCentral African RepublicCentral Europe and the BalticsChadChileChinaColombiaComorosCongo, Dem. Rep.Congo, Rep.Costa RicaCote d'IvoireCroatiaCubaCyprusCzech RepublicDenmarkDjiboutiDominicaDominican RepublicEarly-demographic dividendEast Asia & PacificEast Asia & Pacific (excluding high income)East Asia & Pacific (IDA & IBRD countries)EcuadorEgypt, Arab Rep.El SalvadorEquatorial GuineaEritreaEstoniaEthiopiaEuro areaEurope & Central AsiaEurope & Central Asia (excluding high income)Europe & Central Asia (IDA & IBRD countries)European UnionFaroe IslandsFijiFinlandFragile and conflict affected situationsFranceFrench PolynesiaGabonGambia, TheGeorgiaGermanyGhanaGreeceGrenadaGuatemalaGuineaGuinea-BissauGuyanaHaitiHeavily indebted poor countries (HIPC)High incomeHondurasHong Kong SAR, ChinaHungaryIBRD onlyIcelandIDA & IBRD totalIDA blendIDA onlyIDA totalIndiaIndonesiaIran, Islamic Rep.IraqIrelandIsraelItalyJamaicaJapanJordanKazakhstanKenyaKiribatiKorea, Rep.KosovoKuwaitKyrgyz RepublicLao PDRLate-demographic dividendLatin America & Caribbean Latin America & Caribbean (excluding high income)Latin America & the Caribbean (IDA & IBRD countries)LatviaLeast developed countries: UN classificationLebanonLesothoLiberiaLibyaLithuaniaLow & middle incomeLow incomeLower middle incomeLuxembourgMacao SAR, ChinaMacedonia, FYRMadagascarMalawiMalaysiaMaldivesMaliMaltaMauritaniaMauritiusMexicoMicronesia, Fed. Sts.Middle East & North AfricaMiddle East & North Africa (excluding high income)Middle East & North Africa (IDA & IBRD countries)Middle incomeMoldovaMongoliaMontenegroMoroccoMozambiqueMyanmarNamibiaNepalNetherlandsNew CaledoniaNew ZealandNicaraguaNigerNigeriaNorth AmericaNorwayOECD membersOmanOther small statesPacific island small statesPakistanPalauPanamaPapua New GuineaParaguayPeruPhilippinesPolandPortugalPost-demographic dividendPre-demographic dividendPuerto RicoQatarRomaniaRussian FederationRwandaSamoaSaudi ArabiaSenegalSerbiaSeychellesSierra LeoneSingaporeSlovak RepublicSloveniaSmall statesSolomon IslandsSomaliaSouth AfricaSouth AsiaSouth Asia (IDA & IBRD)South SudanSpainSri LankaSt. Kitts and NevisSt. LuciaSt. Vincent and the GrenadinesSub-Saharan Africa Sub-Saharan Africa (excluding high income)Sub-Saharan Africa (IDA & IBRD countries)SudanSurinameSwazilandSwedenSwitzerlandSyrian Arab RepublicTajikistanTanzaniaThailandTimor-LesteTogoTongaTrinidad and TobagoTunisiaTurkeyTurkmenistanUgandaUkraineUnited Arab EmiratesUnited KingdomUnited StatesUpper middle incomeUruguayUzbekistanVanuatuVenezuela, RBVietnamWest Bank and GazaWorldYemen, Rep.ZambiaZimbabwe Timeline:
This timeline shows a graph from 1968 to 2016 of Pakistan. No data until 1967. Number of actual observations by date: 49.
Source name:
World Development Indicators
Source organization:
World Bank national accounts data, and OECD National Accounts data files.
Categories, topics:
Economy & Growth, Trade
Last updated:
apr 23, 2017
Indicators value changes by year
Maximum:
17.359
jan 1, 1993
At the date of observation
Value
Absolute change
Change from previous value
jan 1, 1968
9.171
+9.171
0.0%
jan 1, 1969
9.159
-0.012
-0.13%
jan 1, 1970
8.664
-0.495
-5.4%
jan 1, 1971
7.769
-0.896
-10.34%
jan 1, 1972
7.142
-0.626
-8.06%
jan 1, 1973
11.774
+4.632
64.85%
jan 1, 1974
13.527
+1.753
14.88%
jan 1, 1975
13.681
+0.154
1.14%
jan 1, 1976
10.854
-2.827
-20.66%
jan 1, 1977
10.722
-0.132
-1.22%
jan 1, 1978
9.285
-1.437
-13.4%
jan 1, 1979
9.241
-0.044
-0.47%
jan 1, 1980
10.693
+1.452
15.71%
jan 1, 1981
12.487
+1.795
16.78%
jan 1, 1982
12.317
-0.17
-1.36%
jan 1, 1983
9.946
-2.372
-19.25%
jan 1, 1984
11.919
+1.973
19.84%
jan 1, 1985
11.07
-0.848
-7.12%
jan 1, 1986
10.423
-0.647
-5.84%
jan 1, 1987
11.901
+1.477
14.17%
jan 1, 1988
13.235
+1.334
11.21%
jan 1, 1989
13.586
+0.352
2.66%
jan 1, 1990
13.883
+0.297
2.18%
jan 1, 1991
15.538
+1.655
11.92%
jan 1, 1992
16.997
+1.459
9.39%
jan 1, 1993
17.359
+0.362
2.13%
jan 1, 1994
16.306
-1.053
-6.06%
jan 1, 1995
16.283
-0.024
-0.15%
jan 1, 1996
16.71
+0.427
2.63%
jan 1, 1997
16.903
+0.193
1.16%
jan 1, 1998
16.082
-0.821
-4.86%
jan 1, 1999
16.485
+0.403
2.5%
jan 1, 2000
15.353
-1.131
-6.86%
jan 1, 2001
13.441
-1.912
-12.45%
jan 1, 2002
14.66
+1.218
9.06%
jan 1, 2003
15.224
+0.564
3.85%
jan 1, 2004
16.719
+1.495
9.82%
jan 1, 2005
15.667
-1.052
-6.29%
jan 1, 2006
15.689
+0.023
0.14%
jan 1, 2007
14.134
-1.556
-9.91%
jan 1, 2008
13.215
-0.919
-6.5%
jan 1, 2009
12.382
-0.832
-6.3%
jan 1, 2010
12.396
+0.013
0.11%
jan 1, 2011
13.516
+1.121
9.04%
jan 1, 2012
13.967
+0.45
3.33%
jan 1, 2013
12.397
-1.57
-11.24%
jan 1, 2014
13.277
+0.88
7.1%
jan 1, 2015
12.243
-1.035
-7.79%
jan 1, 2016
10.585
-1.657
-13.54%
Ranking of countries by current statistics by years


Comments: