29
/
en
AIzaSyAYiBZKx7MnpbEhh9jyipgxe19OcubqV5w
April 1, 2024
36523
IBRD only
IBD
false
2
1
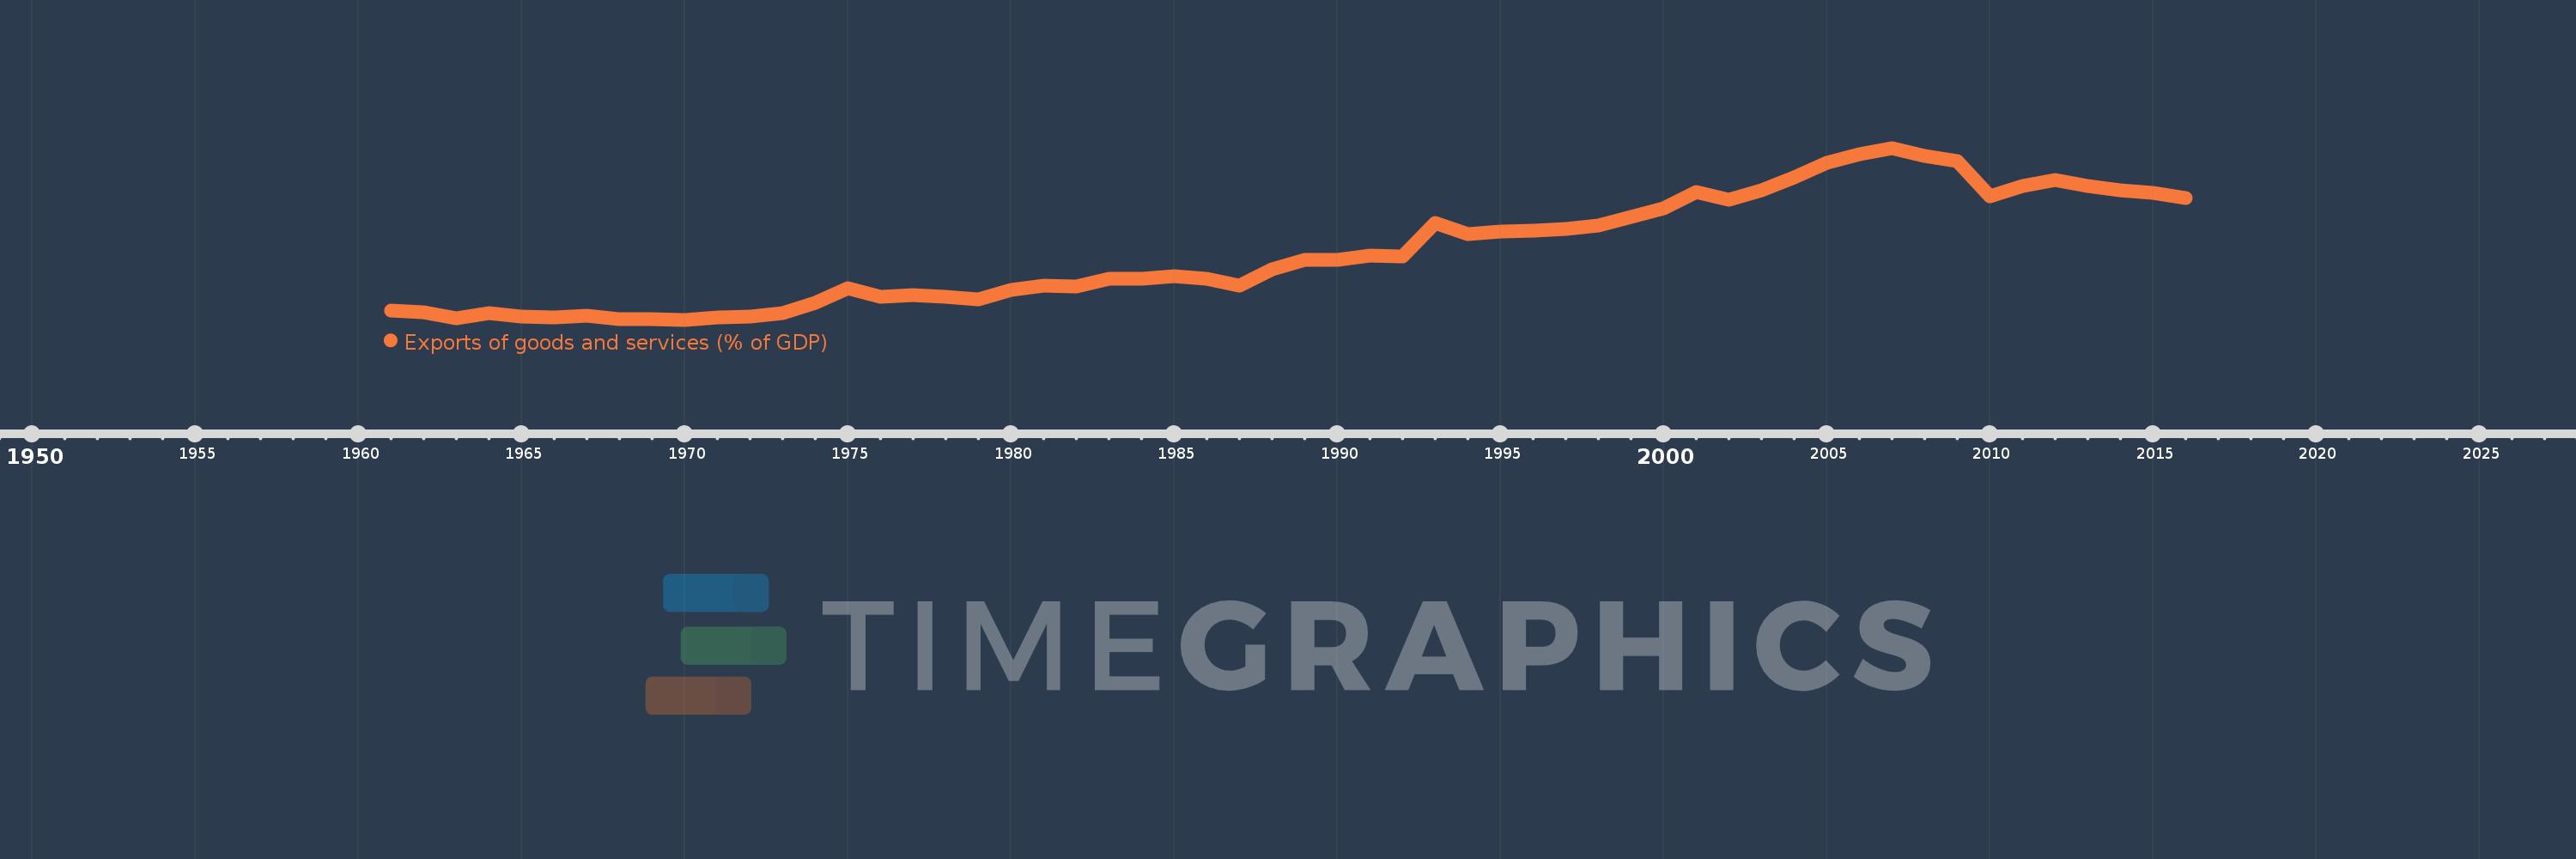
Exports of goods and services (% of GDP)
2016,2015,2014,2013,2012,2011,2010,2009,2008,2007,2006,2005,2004,2003,2002,2001,2000,1999,1998,1997,1996,1995,1994,1993,1992,1991,1990,1989,1988,1987,1986,1985,1984,1983,1982,1981,1980,1979,1978,1977,1976,1975,1974,1973,1972,1971,1970,1969,1968,1967,1966,1965,1964,1963,1962,1961
This statistics in other country:
AfghanistanAlbaniaAlgeriaAngolaAntigua and BarbudaArab WorldArgentinaArmeniaArubaAustraliaAustriaAzerbaijanBahamas, TheBahrainBangladeshBarbadosBelarusBelgiumBelizeBeninBermudaBhutanBoliviaBosnia and HerzegovinaBotswanaBrazilBrunei DarussalamBulgariaBurkina FasoBurundiCabo VerdeCambodiaCameroonCanadaCaribbean small statesCentral African RepublicCentral Europe and the BalticsChadChileChinaColombiaComorosCongo, Dem. Rep.Congo, Rep.Costa RicaCote d'IvoireCroatiaCubaCyprusCzech RepublicDenmarkDjiboutiDominicaDominican RepublicEarly-demographic dividendEast Asia & PacificEast Asia & Pacific (excluding high income)East Asia & Pacific (IDA & IBRD countries)EcuadorEgypt, Arab Rep.El SalvadorEquatorial GuineaEritreaEstoniaEthiopiaEuro areaEurope & Central AsiaEurope & Central Asia (excluding high income)Europe & Central Asia (IDA & IBRD countries)European UnionFaroe IslandsFijiFinlandFragile and conflict affected situationsFranceFrench PolynesiaGabonGambia, TheGeorgiaGermanyGhanaGreeceGrenadaGuatemalaGuineaGuinea-BissauGuyanaHaitiHeavily indebted poor countries (HIPC)High incomeHondurasHong Kong SAR, ChinaHungaryIBRD onlyIcelandIDA & IBRD totalIDA blendIDA onlyIDA totalIndiaIndonesiaIran, Islamic Rep.IraqIrelandIsraelItalyJamaicaJapanJordanKazakhstanKenyaKiribatiKorea, Rep.KosovoKuwaitKyrgyz RepublicLao PDRLate-demographic dividendLatin America & Caribbean Latin America & Caribbean (excluding high income)Latin America & the Caribbean (IDA & IBRD countries)LatviaLeast developed countries: UN classificationLebanonLesothoLiberiaLibyaLithuaniaLow & middle incomeLow incomeLower middle incomeLuxembourgMacao SAR, ChinaMacedonia, FYRMadagascarMalawiMalaysiaMaldivesMaliMaltaMauritaniaMauritiusMexicoMicronesia, Fed. Sts.Middle East & North AfricaMiddle East & North Africa (excluding high income)Middle East & North Africa (IDA & IBRD countries)Middle incomeMoldovaMongoliaMontenegroMoroccoMozambiqueMyanmarNamibiaNepalNetherlandsNew CaledoniaNew ZealandNicaraguaNigerNigeriaNorth AmericaNorwayOECD membersOmanOther small statesPacific island small statesPakistanPalauPanamaPapua New GuineaParaguayPeruPhilippinesPolandPortugalPost-demographic dividendPre-demographic dividendPuerto RicoQatarRomaniaRussian FederationRwandaSamoaSaudi ArabiaSenegalSerbiaSeychellesSierra LeoneSingaporeSlovak RepublicSloveniaSmall statesSolomon IslandsSomaliaSouth AfricaSouth AsiaSouth Asia (IDA & IBRD)South SudanSpainSri LankaSt. Kitts and NevisSt. LuciaSt. Vincent and the GrenadinesSub-Saharan Africa Sub-Saharan Africa (excluding high income)Sub-Saharan Africa (IDA & IBRD countries)SudanSurinameSwazilandSwedenSwitzerlandSyrian Arab RepublicTajikistanTanzaniaThailandTimor-LesteTogoTongaTrinidad and TobagoTunisiaTurkeyTurkmenistanUgandaUkraineUnited Arab EmiratesUnited KingdomUnited StatesUpper middle incomeUruguayUzbekistanVanuatuVenezuela, RBVietnamWest Bank and GazaWorldYemen, Rep.ZambiaZimbabwe Timeline:
This timeline shows a graph from 1961 to 2016 of IBRD only. No data until 1960. Number of actual observations by date: 56.
Source name:
World Development Indicators
Source organization:
World Bank national accounts data, and OECD National Accounts data files.
Categories, topics:
Economy & Growth, Trade
Last updated:
apr 23, 2017
Indicators value changes by year
At the date of observation
Value
Absolute change
Change from previous value
jan 1, 1961
9.452
+9.452
0.0%
jan 1, 1962
9.194
-0.258
-2.73%
jan 1, 1963
8.339
-0.856
-9.31%
jan 1, 1964
9.085
+0.746
8.95%
jan 1, 1965
8.645
-0.439
-4.84%
jan 1, 1966
8.439
-0.206
-2.38%
jan 1, 1967
8.681
+0.242
2.87%
jan 1, 1968
8.172
-0.509
-5.86%
jan 1, 1969
8.232
+0.06
0.73%
jan 1, 1970
8.12
-0.112
-1.36%
jan 1, 1971
8.43
+0.31
3.82%
jan 1, 1972
8.584
+0.154
1.83%
jan 1, 1973
9.105
+0.52
6.06%
jan 1, 1974
10.664
+1.56
17.13%
jan 1, 1975
12.755
+2.091
19.6%
jan 1, 1976
11.515
-1.24
-9.72%
jan 1, 1977
11.753
+0.238
2.06%
jan 1, 1978
11.532
-0.221
-1.88%
jan 1, 1979
11.129
-0.403
-3.49%
jan 1, 1980
12.525
+1.396
12.54%
jan 1, 1981
13.164
+0.64
5.11%
jan 1, 1982
12.978
-0.186
-1.41%
jan 1, 1983
14.114
+1.135
8.75%
jan 1, 1984
14.135
+0.022
0.16%
jan 1, 1985
14.609
+0.473
3.35%
jan 1, 1986
14.144
-0.465
-3.18%
jan 1, 1987
13.119
-1.025
-7.25%
jan 1, 1988
15.516
+2.397
18.27%
jan 1, 1989
16.961
+1.445
9.31%
jan 1, 1990
16.948
-0.013
-0.08%
jan 1, 1991
17.593
+0.645
3.81%
jan 1, 1992
17.469
-0.124
-0.7%
jan 1, 1993
22.452
+4.983
28.52%
jan 1, 1994
20.724
-1.728
-7.7%
jan 1, 1995
21.103
+0.38
1.83%
jan 1, 1996
21.254
+0.151
0.72%
jan 1, 1997
21.518
+0.263
1.24%
jan 1, 1998
22.044
+0.527
2.45%
jan 1, 1999
23.333
+1.289
5.85%
jan 1, 2000
24.566
+1.233
5.28%
jan 1, 2001
26.943
+2.377
9.68%
jan 1, 2002
25.872
-1.071
-3.97%
jan 1, 2003
27.204
+1.332
5.15%
jan 1, 2004
29.12
+1.916
7.04%
jan 1, 2005
31.303
+2.182
7.49%
jan 1, 2006
32.548
+1.246
3.98%
jan 1, 2007
33.49
+0.942
2.89%
jan 1, 2008
32.343
-1.148
-3.43%
jan 1, 2009
31.556
-0.787
-2.43%
jan 1, 2010
26.297
-5.259
-16.67%
jan 1, 2011
27.823
+1.527
5.81%
jan 1, 2012
28.764
+0.94
3.38%
jan 1, 2013
27.872
-0.891
-3.1%
jan 1, 2014
27.249
-0.623
-2.23%
jan 1, 2015
26.806
-0.443
-1.63%
jan 1, 2016
26.103
-0.703
-2.62%
Ranking of countries by current statistics by years


Comments: