29
/
en
AIzaSyAYiBZKx7MnpbEhh9jyipgxe19OcubqV5w
April 1, 2024
209263
New Zealand
NZL
true
2
1
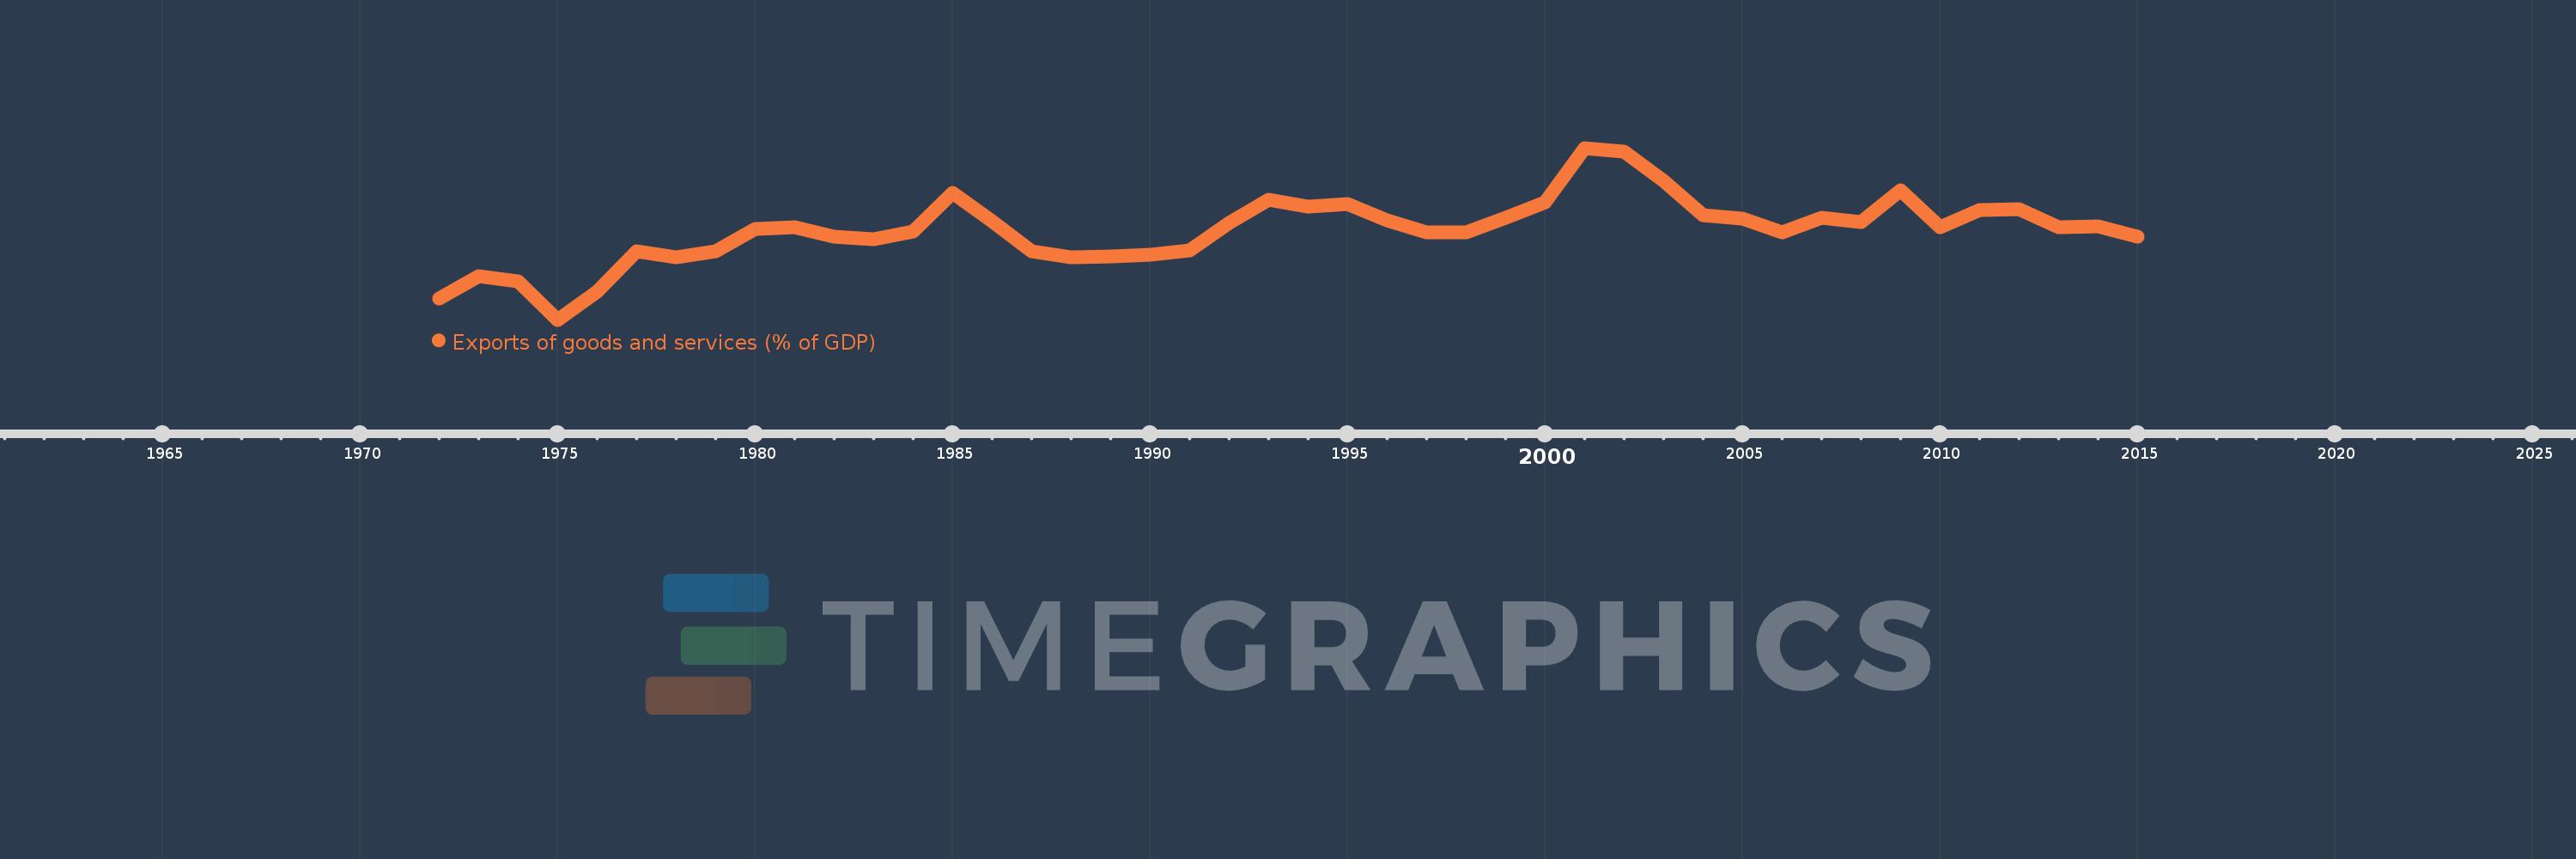
Exports of goods and services (% of GDP)
2015,2014,2013,2012,2011,2010,2009,2008,2007,2006,2005,2004,2003,2002,2001,2000,1999,1998,1997,1996,1995,1994,1993,1992,1991,1990,1989,1988,1987,1986,1985,1984,1983,1982,1981,1980,1979,1978,1977,1976,1975,1974,1973,1972
This statistics in other country:
AfghanistanAlbaniaAlgeriaAngolaAntigua and BarbudaArab WorldArgentinaArmeniaArubaAustraliaAustriaAzerbaijanBahamas, TheBahrainBangladeshBarbadosBelarusBelgiumBelizeBeninBermudaBhutanBoliviaBosnia and HerzegovinaBotswanaBrazilBrunei DarussalamBulgariaBurkina FasoBurundiCabo VerdeCambodiaCameroonCanadaCaribbean small statesCentral African RepublicCentral Europe and the BalticsChadChileChinaColombiaComorosCongo, Dem. Rep.Congo, Rep.Costa RicaCote d'IvoireCroatiaCubaCyprusCzech RepublicDenmarkDjiboutiDominicaDominican RepublicEarly-demographic dividendEast Asia & PacificEast Asia & Pacific (excluding high income)East Asia & Pacific (IDA & IBRD countries)EcuadorEgypt, Arab Rep.El SalvadorEquatorial GuineaEritreaEstoniaEthiopiaEuro areaEurope & Central AsiaEurope & Central Asia (excluding high income)Europe & Central Asia (IDA & IBRD countries)European UnionFaroe IslandsFijiFinlandFragile and conflict affected situationsFranceFrench PolynesiaGabonGambia, TheGeorgiaGermanyGhanaGreeceGrenadaGuatemalaGuineaGuinea-BissauGuyanaHaitiHeavily indebted poor countries (HIPC)High incomeHondurasHong Kong SAR, ChinaHungaryIBRD onlyIcelandIDA & IBRD totalIDA blendIDA onlyIDA totalIndiaIndonesiaIran, Islamic Rep.IraqIrelandIsraelItalyJamaicaJapanJordanKazakhstanKenyaKiribatiKorea, Rep.KosovoKuwaitKyrgyz RepublicLao PDRLate-demographic dividendLatin America & Caribbean Latin America & Caribbean (excluding high income)Latin America & the Caribbean (IDA & IBRD countries)LatviaLeast developed countries: UN classificationLebanonLesothoLiberiaLibyaLithuaniaLow & middle incomeLow incomeLower middle incomeLuxembourgMacao SAR, ChinaMacedonia, FYRMadagascarMalawiMalaysiaMaldivesMaliMaltaMauritaniaMauritiusMexicoMicronesia, Fed. Sts.Middle East & North AfricaMiddle East & North Africa (excluding high income)Middle East & North Africa (IDA & IBRD countries)Middle incomeMoldovaMongoliaMontenegroMoroccoMozambiqueMyanmarNamibiaNepalNetherlandsNew CaledoniaNew ZealandNicaraguaNigerNigeriaNorth AmericaNorwayOECD membersOmanOther small statesPacific island small statesPakistanPalauPanamaPapua New GuineaParaguayPeruPhilippinesPolandPortugalPost-demographic dividendPre-demographic dividendPuerto RicoQatarRomaniaRussian FederationRwandaSamoaSaudi ArabiaSenegalSerbiaSeychellesSierra LeoneSingaporeSlovak RepublicSloveniaSmall statesSolomon IslandsSomaliaSouth AfricaSouth AsiaSouth Asia (IDA & IBRD)South SudanSpainSri LankaSt. Kitts and NevisSt. LuciaSt. Vincent and the GrenadinesSub-Saharan Africa Sub-Saharan Africa (excluding high income)Sub-Saharan Africa (IDA & IBRD countries)SudanSurinameSwazilandSwedenSwitzerlandSyrian Arab RepublicTajikistanTanzaniaThailandTimor-LesteTogoTongaTrinidad and TobagoTunisiaTurkeyTurkmenistanUgandaUkraineUnited Arab EmiratesUnited KingdomUnited StatesUpper middle incomeUruguayUzbekistanVanuatuVenezuela, RBVietnamWest Bank and GazaWorldYemen, Rep.ZambiaZimbabwe Timeline:
This timeline shows a graph from 1972 to 2015 of New Zealand. No data until 1971. Number of actual observations by date: 44.
Source name:
World Development Indicators
Source organization:
World Bank national accounts data, and OECD National Accounts data files.
Categories, topics:
Economy & Growth, Trade
Last updated:
apr 23, 2017
Indicators value changes by year
Minimum:
20.625
jan 1, 1975
Maximum:
35.745
jan 1, 2001
At the date of observation
Value
Absolute change
Change from previous value
jan 1, 1972
22.491
+22.491
0.0%
jan 1, 1973
24.454
+1.963
8.73%
jan 1, 1974
24.008
-0.446
-1.82%
jan 1, 1975
20.625
-3.383
-14.09%
jan 1, 1976
23.103
+2.478
12.01%
jan 1, 1977
26.683
+3.58
15.49%
jan 1, 1978
26.148
-0.535
-2.01%
jan 1, 1979
26.646
+0.498
1.9%
jan 1, 1980
28.63
+1.984
7.45%
jan 1, 1981
28.804
+0.174
0.61%
jan 1, 1982
27.926
-0.878
-3.05%
jan 1, 1983
27.735
-0.19
-0.68%
jan 1, 1984
28.409
+0.674
2.43%
jan 1, 1985
31.811
+3.402
11.98%
jan 1, 1986
29.304
-2.508
-7.88%
jan 1, 1987
26.637
-2.667
-9.1%
jan 1, 1988
26.122
-0.515
-1.93%
jan 1, 1989
26.193
+0.072
0.27%
jan 1, 1990
26.351
+0.157
0.6%
jan 1, 1991
26.762
+0.411
1.56%
jan 1, 1992
29.161
+2.4
8.97%
jan 1, 1993
31.192
+2.031
6.96%
jan 1, 1994
30.603
-0.589
-1.89%
jan 1, 1995
30.778
+0.175
0.57%
jan 1, 1996
29.393
-1.384
-4.5%
jan 1, 1997
28.349
-1.044
-3.55%
jan 1, 1998
28.321
-0.028
-0.1%
jan 1, 1999
29.618
+1.297
4.58%
jan 1, 2000
30.951
+1.333
4.5%
jan 1, 2001
35.745
+4.794
15.49%
jan 1, 2002
35.431
-0.314
-0.88%
jan 1, 2003
32.847
-2.584
-7.29%
jan 1, 2004
29.84
-3.007
-9.15%
jan 1, 2005
29.543
-0.296
-0.99%
jan 1, 2006
28.285
-1.258
-4.26%
jan 1, 2007
29.591
+1.305
4.61%
jan 1, 2008
29.246
-0.344
-1.16%
jan 1, 2009
32.043
+2.797
9.56%
jan 1, 2010
28.742
-3.301
-10.3%
jan 1, 2011
30.261
+1.518
5.28%
jan 1, 2012
30.364
+0.104
0.34%
jan 1, 2013
28.792
-1.573
-5.18%
jan 1, 2014
28.813
+0.021
0.07%
jan 1, 2015
27.971
-0.842
-2.92%
Ranking of countries by current statistics by years


Comments: