29
/
en
AIzaSyAYiBZKx7MnpbEhh9jyipgxe19OcubqV5w
April 1, 2024
265709
Tonga
TON
true
2
1
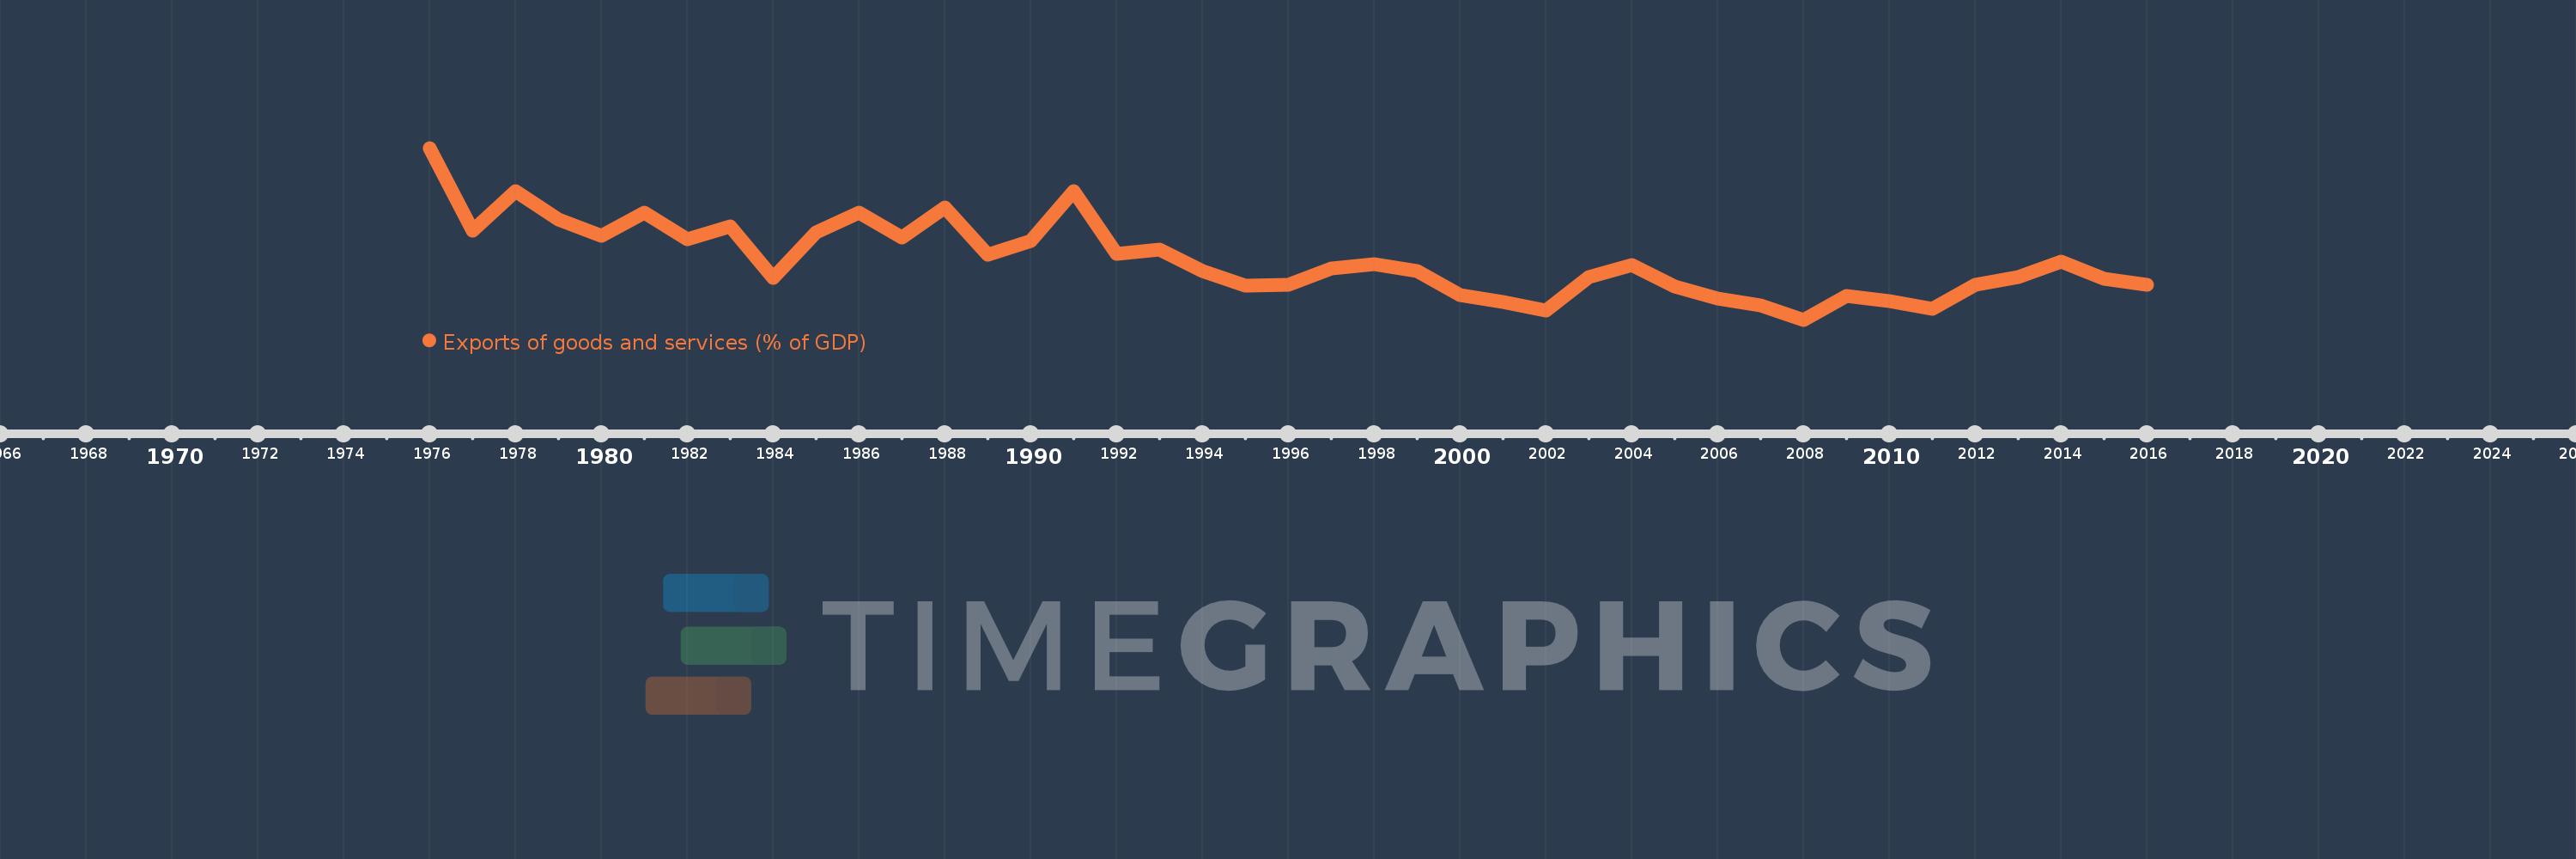
Exports of goods and services (% of GDP)
2016,2015,2014,2013,2012,2011,2010,2009,2008,2007,2006,2005,2004,2003,2002,2001,2000,1999,1998,1997,1996,1995,1994,1993,1992,1991,1990,1989,1988,1987,1986,1985,1984,1983,1982,1981,1980,1979,1978,1977,1976
This statistics in other country:
AfghanistanAlbaniaAlgeriaAngolaAntigua and BarbudaArab WorldArgentinaArmeniaArubaAustraliaAustriaAzerbaijanBahamas, TheBahrainBangladeshBarbadosBelarusBelgiumBelizeBeninBermudaBhutanBoliviaBosnia and HerzegovinaBotswanaBrazilBrunei DarussalamBulgariaBurkina FasoBurundiCabo VerdeCambodiaCameroonCanadaCaribbean small statesCentral African RepublicCentral Europe and the BalticsChadChileChinaColombiaComorosCongo, Dem. Rep.Congo, Rep.Costa RicaCote d'IvoireCroatiaCubaCyprusCzech RepublicDenmarkDjiboutiDominicaDominican RepublicEarly-demographic dividendEast Asia & PacificEast Asia & Pacific (excluding high income)East Asia & Pacific (IDA & IBRD countries)EcuadorEgypt, Arab Rep.El SalvadorEquatorial GuineaEritreaEstoniaEthiopiaEuro areaEurope & Central AsiaEurope & Central Asia (excluding high income)Europe & Central Asia (IDA & IBRD countries)European UnionFaroe IslandsFijiFinlandFragile and conflict affected situationsFranceFrench PolynesiaGabonGambia, TheGeorgiaGermanyGhanaGreeceGrenadaGuatemalaGuineaGuinea-BissauGuyanaHaitiHeavily indebted poor countries (HIPC)High incomeHondurasHong Kong SAR, ChinaHungaryIBRD onlyIcelandIDA & IBRD totalIDA blendIDA onlyIDA totalIndiaIndonesiaIran, Islamic Rep.IraqIrelandIsraelItalyJamaicaJapanJordanKazakhstanKenyaKiribatiKorea, Rep.KosovoKuwaitKyrgyz RepublicLao PDRLate-demographic dividendLatin America & Caribbean Latin America & Caribbean (excluding high income)Latin America & the Caribbean (IDA & IBRD countries)LatviaLeast developed countries: UN classificationLebanonLesothoLiberiaLibyaLithuaniaLow & middle incomeLow incomeLower middle incomeLuxembourgMacao SAR, ChinaMacedonia, FYRMadagascarMalawiMalaysiaMaldivesMaliMaltaMauritaniaMauritiusMexicoMicronesia, Fed. Sts.Middle East & North AfricaMiddle East & North Africa (excluding high income)Middle East & North Africa (IDA & IBRD countries)Middle incomeMoldovaMongoliaMontenegroMoroccoMozambiqueMyanmarNamibiaNepalNetherlandsNew CaledoniaNew ZealandNicaraguaNigerNigeriaNorth AmericaNorwayOECD membersOmanOther small statesPacific island small statesPakistanPalauPanamaPapua New GuineaParaguayPeruPhilippinesPolandPortugalPost-demographic dividendPre-demographic dividendPuerto RicoQatarRomaniaRussian FederationRwandaSamoaSaudi ArabiaSenegalSerbiaSeychellesSierra LeoneSingaporeSlovak RepublicSloveniaSmall statesSolomon IslandsSomaliaSouth AfricaSouth AsiaSouth Asia (IDA & IBRD)South SudanSpainSri LankaSt. Kitts and NevisSt. LuciaSt. Vincent and the GrenadinesSub-Saharan Africa Sub-Saharan Africa (excluding high income)Sub-Saharan Africa (IDA & IBRD countries)SudanSurinameSwazilandSwedenSwitzerlandSyrian Arab RepublicTajikistanTanzaniaThailandTimor-LesteTogoTongaTrinidad and TobagoTunisiaTurkeyTurkmenistanUgandaUkraineUnited Arab EmiratesUnited KingdomUnited StatesUpper middle incomeUruguayUzbekistanVanuatuVenezuela, RBVietnamWest Bank and GazaWorldYemen, Rep.ZambiaZimbabwe Timeline:
This timeline shows a graph from 1976 to 2016 of Tonga. No data until 1975. Number of actual observations by date: 41.
Source name:
World Development Indicators
Source organization:
World Bank national accounts data, and OECD National Accounts data files.
Categories, topics:
Economy & Growth, Trade
Last updated:
apr 23, 2017
Indicators value changes by year
Minimum:
11.382
jan 1, 2008
At the date of observation
Value
Absolute change
Change from previous value
jan 1, 1976
41.33
+41.33
0.0%
jan 1, 1977
26.936
-14.394
-34.83%
jan 1, 1978
33.866
+6.93
25.73%
jan 1, 1979
28.789
-5.077
-14.99%
jan 1, 1980
26.078
-2.711
-9.42%
jan 1, 1981
30.062
+3.984
15.28%
jan 1, 1982
25.375
-4.687
-15.59%
jan 1, 1983
27.588
+2.213
8.72%
jan 1, 1984
18.658
-8.93
-32.37%
jan 1, 1985
26.608
+7.95
42.61%
jan 1, 1986
30.129
+3.521
13.23%
jan 1, 1987
25.712
-4.416
-14.66%
jan 1, 1988
30.927
+5.214
20.28%
jan 1, 1989
22.737
-8.19
-26.48%
jan 1, 1990
25.103
+2.367
10.41%
jan 1, 1991
33.87
+8.767
34.92%
jan 1, 1992
22.903
-10.967
-32.38%
jan 1, 1993
23.642
+0.739
3.23%
jan 1, 1994
19.894
-3.748
-15.85%
jan 1, 1995
17.382
-2.513
-12.63%
jan 1, 1996
17.489
+0.107
0.62%
jan 1, 1997
20.35
+2.861
16.36%
jan 1, 1998
21.139
+0.789
3.88%
jan 1, 1999
19.881
-1.259
-5.95%
jan 1, 2000
15.634
-4.247
-21.36%
jan 1, 2001
14.444
-1.19
-7.61%
jan 1, 2002
13.038
-1.406
-9.73%
jan 1, 2003
18.814
+5.775
44.3%
jan 1, 2004
20.994
+2.18
11.59%
jan 1, 2005
17.247
-3.747
-17.85%
jan 1, 2006
15.153
-2.094
-12.14%
jan 1, 2007
13.855
-1.297
-8.56%
jan 1, 2008
11.382
-2.474
-17.85%
jan 1, 2009
15.575
+4.194
36.85%
jan 1, 2010
14.611
-0.965
-6.19%
jan 1, 2011
13.312
-1.298
-8.89%
jan 1, 2012
17.536
+4.224
31.73%
jan 1, 2013
18.861
+1.325
7.56%
jan 1, 2014
21.531
+2.669
14.15%
jan 1, 2015
18.499
-3.031
-14.08%
jan 1, 2016
17.527
-0.973
-5.26%
Ranking of countries by current statistics by years


Comments: