29
/
en
AIzaSyAYiBZKx7MnpbEhh9jyipgxe19OcubqV5w
April 1, 2024
223488
Philippines
PHL
true
2
1
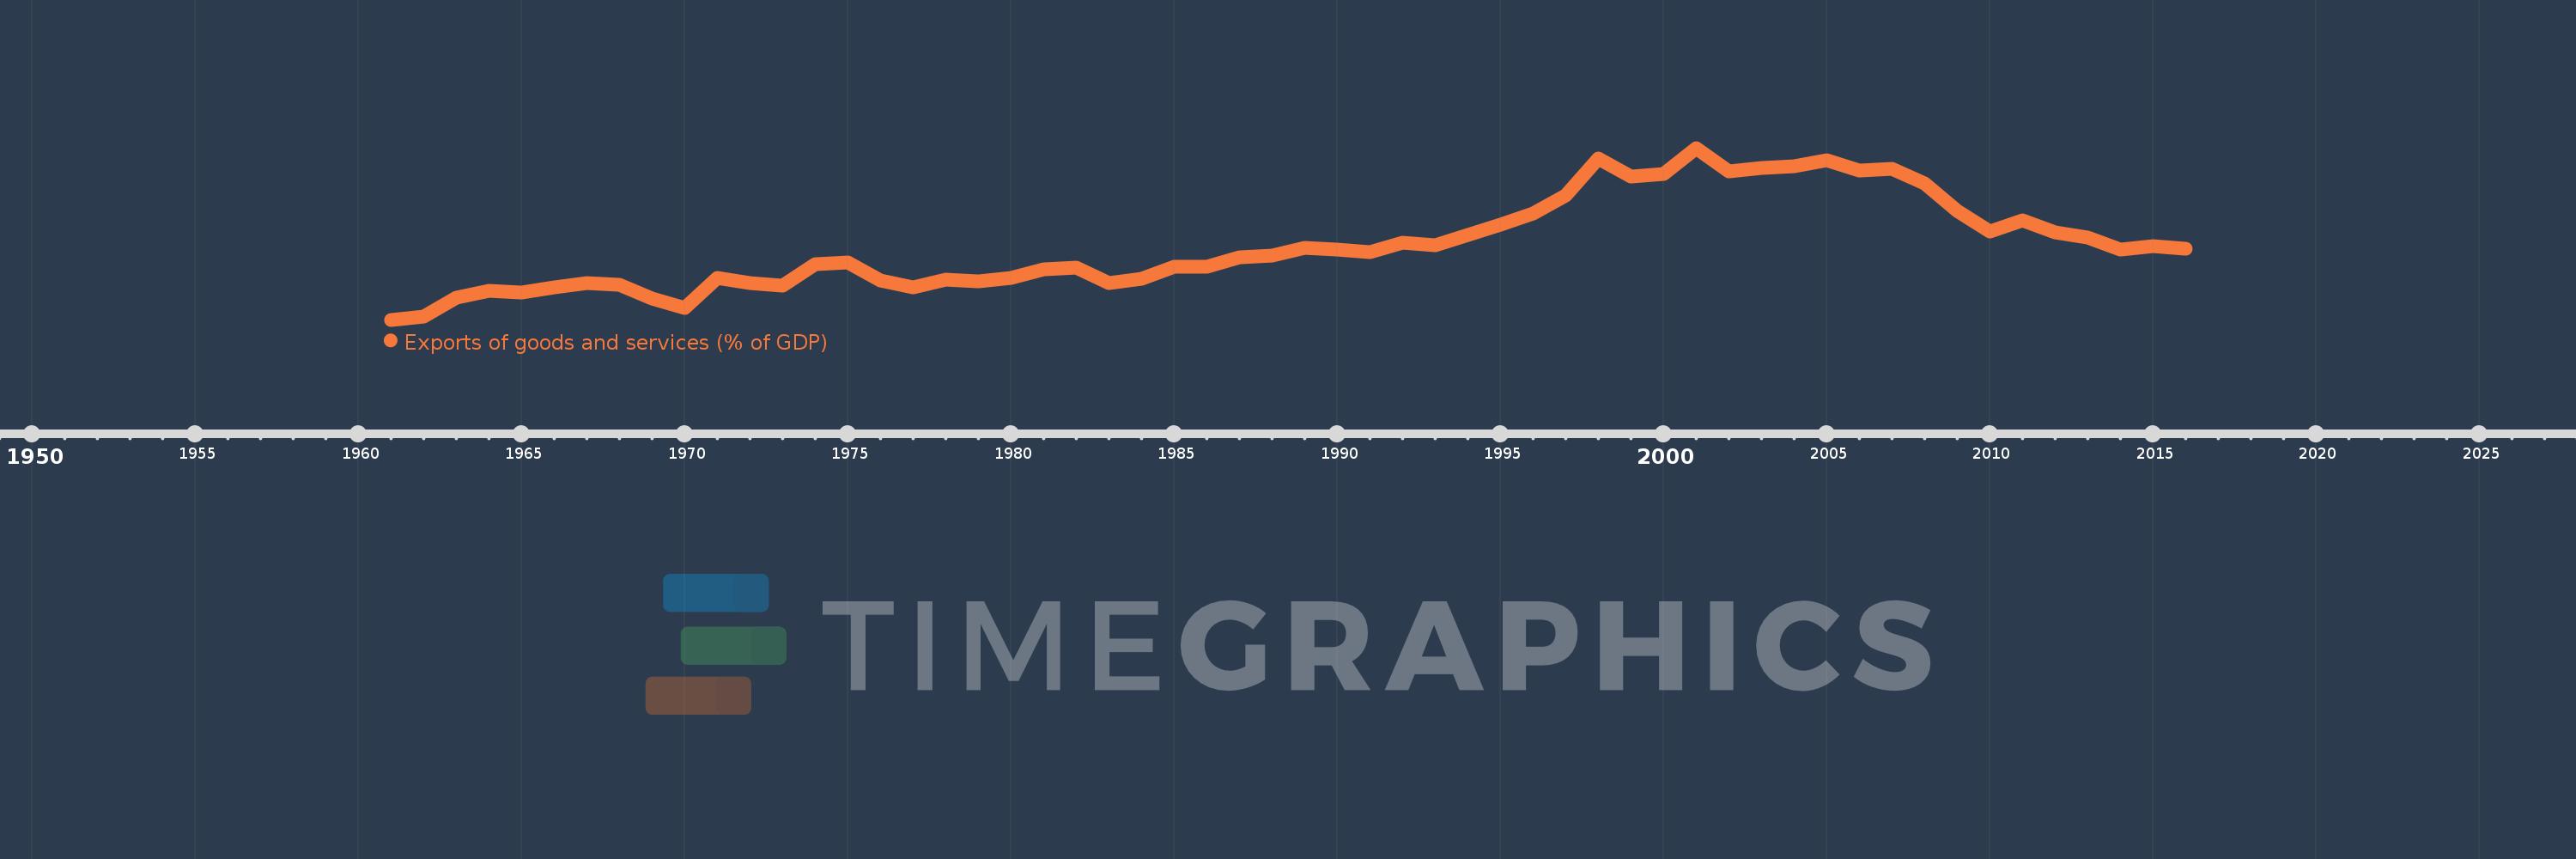
Exports of goods and services (% of GDP)
2016,2015,2014,2013,2012,2011,2010,2009,2008,2007,2006,2005,2004,2003,2002,2001,2000,1999,1998,1997,1996,1995,1994,1993,1992,1991,1990,1989,1988,1987,1986,1985,1984,1983,1982,1981,1980,1979,1978,1977,1976,1975,1974,1973,1972,1971,1970,1969,1968,1967,1966,1965,1964,1963,1962,1961
This statistics in other country:
AfghanistanAlbaniaAlgeriaAngolaAntigua and BarbudaArab WorldArgentinaArmeniaArubaAustraliaAustriaAzerbaijanBahamas, TheBahrainBangladeshBarbadosBelarusBelgiumBelizeBeninBermudaBhutanBoliviaBosnia and HerzegovinaBotswanaBrazilBrunei DarussalamBulgariaBurkina FasoBurundiCabo VerdeCambodiaCameroonCanadaCaribbean small statesCentral African RepublicCentral Europe and the BalticsChadChileChinaColombiaComorosCongo, Dem. Rep.Congo, Rep.Costa RicaCote d'IvoireCroatiaCubaCyprusCzech RepublicDenmarkDjiboutiDominicaDominican RepublicEarly-demographic dividendEast Asia & PacificEast Asia & Pacific (excluding high income)East Asia & Pacific (IDA & IBRD countries)EcuadorEgypt, Arab Rep.El SalvadorEquatorial GuineaEritreaEstoniaEthiopiaEuro areaEurope & Central AsiaEurope & Central Asia (excluding high income)Europe & Central Asia (IDA & IBRD countries)European UnionFaroe IslandsFijiFinlandFragile and conflict affected situationsFranceFrench PolynesiaGabonGambia, TheGeorgiaGermanyGhanaGreeceGrenadaGuatemalaGuineaGuinea-BissauGuyanaHaitiHeavily indebted poor countries (HIPC)High incomeHondurasHong Kong SAR, ChinaHungaryIBRD onlyIcelandIDA & IBRD totalIDA blendIDA onlyIDA totalIndiaIndonesiaIran, Islamic Rep.IraqIrelandIsraelItalyJamaicaJapanJordanKazakhstanKenyaKiribatiKorea, Rep.KosovoKuwaitKyrgyz RepublicLao PDRLate-demographic dividendLatin America & Caribbean Latin America & Caribbean (excluding high income)Latin America & the Caribbean (IDA & IBRD countries)LatviaLeast developed countries: UN classificationLebanonLesothoLiberiaLibyaLithuaniaLow & middle incomeLow incomeLower middle incomeLuxembourgMacao SAR, ChinaMacedonia, FYRMadagascarMalawiMalaysiaMaldivesMaliMaltaMauritaniaMauritiusMexicoMicronesia, Fed. Sts.Middle East & North AfricaMiddle East & North Africa (excluding high income)Middle East & North Africa (IDA & IBRD countries)Middle incomeMoldovaMongoliaMontenegroMoroccoMozambiqueMyanmarNamibiaNepalNetherlandsNew CaledoniaNew ZealandNicaraguaNigerNigeriaNorth AmericaNorwayOECD membersOmanOther small statesPacific island small statesPakistanPalauPanamaPapua New GuineaParaguayPeruPhilippinesPolandPortugalPost-demographic dividendPre-demographic dividendPuerto RicoQatarRomaniaRussian FederationRwandaSamoaSaudi ArabiaSenegalSerbiaSeychellesSierra LeoneSingaporeSlovak RepublicSloveniaSmall statesSolomon IslandsSomaliaSouth AfricaSouth AsiaSouth Asia (IDA & IBRD)South SudanSpainSri LankaSt. Kitts and NevisSt. LuciaSt. Vincent and the GrenadinesSub-Saharan Africa Sub-Saharan Africa (excluding high income)Sub-Saharan Africa (IDA & IBRD countries)SudanSurinameSwazilandSwedenSwitzerlandSyrian Arab RepublicTajikistanTanzaniaThailandTimor-LesteTogoTongaTrinidad and TobagoTunisiaTurkeyTurkmenistanUgandaUkraineUnited Arab EmiratesUnited KingdomUnited StatesUpper middle incomeUruguayUzbekistanVanuatuVenezuela, RBVietnamWest Bank and GazaWorldYemen, Rep.ZambiaZimbabwe Timeline:
This timeline shows a graph from 1961 to 2016 of Philippines. No data until 1960. Number of actual observations by date: 56.
Source name:
World Development Indicators
Source organization:
World Bank national accounts data, and OECD National Accounts data files.
Categories, topics:
Economy & Growth, Trade
Last updated:
apr 23, 2017
Indicators value changes by year
Minimum:
11.947
jan 1, 1961
Maximum:
51.369
jan 1, 2001
At the date of observation
Value
Absolute change
Change from previous value
jan 1, 1961
11.947
+11.947
0.0%
jan 1, 1962
12.592
+0.645
5.4%
jan 1, 1963
16.948
+4.355
34.59%
jan 1, 1964
18.617
+1.67
9.85%
jan 1, 1965
18.185
-0.432
-2.32%
jan 1, 1966
19.384
+1.199
6.59%
jan 1, 1967
20.448
+1.064
5.49%
jan 1, 1968
19.965
-0.483
-2.36%
jan 1, 1969
16.903
-3.062
-15.34%
jan 1, 1970
14.727
-2.176
-12.87%
jan 1, 1971
21.576
+6.85
46.51%
jan 1, 1972
20.454
-1.122
-5.2%
jan 1, 1973
19.68
-0.774
-3.78%
jan 1, 1974
24.767
+5.087
25.85%
jan 1, 1975
25.021
+0.254
1.03%
jan 1, 1976
21.018
-4.003
-16.0%
jan 1, 1977
19.327
-1.691
-8.05%
jan 1, 1978
21.059
+1.732
8.96%
jan 1, 1979
20.667
-0.391
-1.86%
jan 1, 1980
21.561
+0.893
4.32%
jan 1, 1981
23.573
+2.012
9.33%
jan 1, 1982
23.834
+0.261
1.11%
jan 1, 1983
20.334
-3.499
-14.68%
jan 1, 1984
21.34
+1.005
4.94%
jan 1, 1985
24.024
+2.684
12.58%
jan 1, 1986
24.016
-0.009
-0.04%
jan 1, 1987
26.328
+2.313
9.63%
jan 1, 1988
26.642
+0.314
1.19%
jan 1, 1989
28.393
+1.751
6.57%
jan 1, 1990
28.112
-0.281
-0.99%
jan 1, 1991
27.516
-0.596
-2.12%
jan 1, 1992
29.597
+2.081
7.56%
jan 1, 1993
29.13
-0.467
-1.58%
jan 1, 1994
31.36
+2.23
7.65%
jan 1, 1995
33.826
+2.466
7.86%
jan 1, 1996
36.357
+2.532
7.48%
jan 1, 1997
40.507
+4.149
11.41%
jan 1, 1998
48.956
+8.45
20.86%
jan 1, 1999
44.764
-4.192
-8.56%
jan 1, 2000
45.489
+0.725
1.62%
jan 1, 2001
51.369
+5.88
12.93%
jan 1, 2002
46.027
-5.342
-10.4%
jan 1, 2003
46.747
+0.72
1.56%
jan 1, 2004
47.157
+0.41
0.88%
jan 1, 2005
48.573
+1.416
3.0%
jan 1, 2006
46.137
-2.436
-5.01%
jan 1, 2007
46.578
+0.441
0.96%
jan 1, 2008
43.261
-3.317
-7.12%
jan 1, 2009
36.912
-6.349
-14.68%
jan 1, 2010
32.232
-4.68
-12.68%
jan 1, 2011
34.803
+2.571
7.98%
jan 1, 2012
32.031
-2.772
-7.97%
jan 1, 2013
30.819
-1.212
-3.78%
jan 1, 2014
28.018
-2.801
-9.09%
jan 1, 2015
28.845
+0.827
2.95%
jan 1, 2016
28.189
-0.655
-2.27%
Ranking of countries by current statistics by years


Comments: