29
/
en
AIzaSyAYiBZKx7MnpbEhh9jyipgxe19OcubqV5w
April 1, 2024
40660
Late-demographic dividend
LTE
false
2
1
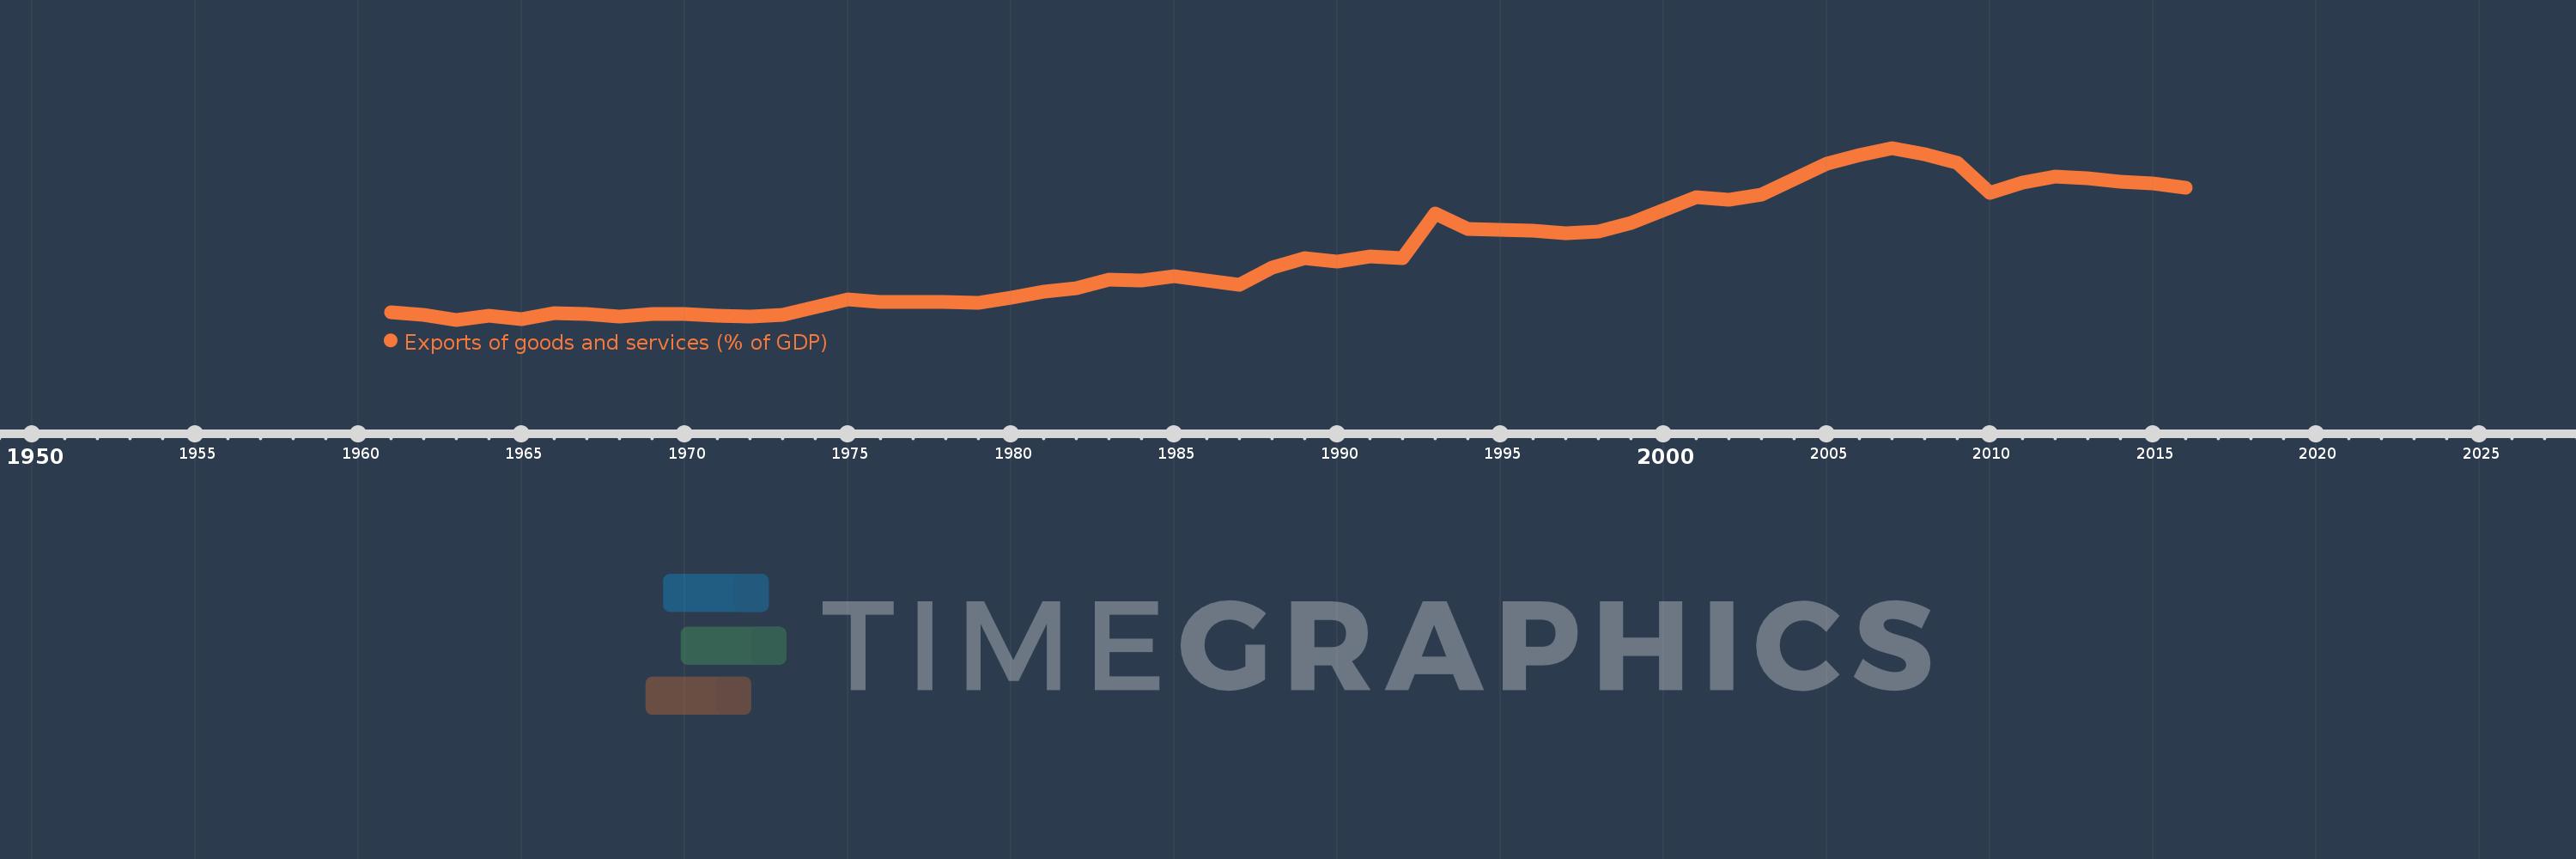
Exports of goods and services (% of GDP)
2016,2015,2014,2013,2012,2011,2010,2009,2008,2007,2006,2005,2004,2003,2002,2001,2000,1999,1998,1997,1996,1995,1994,1993,1992,1991,1990,1989,1988,1987,1986,1985,1984,1983,1982,1981,1980,1979,1978,1977,1976,1975,1974,1973,1972,1971,1970,1969,1968,1967,1966,1965,1964,1963,1962,1961
This statistics in other country:
AfghanistanAlbaniaAlgeriaAngolaAntigua and BarbudaArab WorldArgentinaArmeniaArubaAustraliaAustriaAzerbaijanBahamas, TheBahrainBangladeshBarbadosBelarusBelgiumBelizeBeninBermudaBhutanBoliviaBosnia and HerzegovinaBotswanaBrazilBrunei DarussalamBulgariaBurkina FasoBurundiCabo VerdeCambodiaCameroonCanadaCaribbean small statesCentral African RepublicCentral Europe and the BalticsChadChileChinaColombiaComorosCongo, Dem. Rep.Congo, Rep.Costa RicaCote d'IvoireCroatiaCubaCyprusCzech RepublicDenmarkDjiboutiDominicaDominican RepublicEarly-demographic dividendEast Asia & PacificEast Asia & Pacific (excluding high income)East Asia & Pacific (IDA & IBRD countries)EcuadorEgypt, Arab Rep.El SalvadorEquatorial GuineaEritreaEstoniaEthiopiaEuro areaEurope & Central AsiaEurope & Central Asia (excluding high income)Europe & Central Asia (IDA & IBRD countries)European UnionFaroe IslandsFijiFinlandFragile and conflict affected situationsFranceFrench PolynesiaGabonGambia, TheGeorgiaGermanyGhanaGreeceGrenadaGuatemalaGuineaGuinea-BissauGuyanaHaitiHeavily indebted poor countries (HIPC)High incomeHondurasHong Kong SAR, ChinaHungaryIBRD onlyIcelandIDA & IBRD totalIDA blendIDA onlyIDA totalIndiaIndonesiaIran, Islamic Rep.IraqIrelandIsraelItalyJamaicaJapanJordanKazakhstanKenyaKiribatiKorea, Rep.KosovoKuwaitKyrgyz RepublicLao PDRLate-demographic dividendLatin America & Caribbean Latin America & Caribbean (excluding high income)Latin America & the Caribbean (IDA & IBRD countries)LatviaLeast developed countries: UN classificationLebanonLesothoLiberiaLibyaLithuaniaLow & middle incomeLow incomeLower middle incomeLuxembourgMacao SAR, ChinaMacedonia, FYRMadagascarMalawiMalaysiaMaldivesMaliMaltaMauritaniaMauritiusMexicoMicronesia, Fed. Sts.Middle East & North AfricaMiddle East & North Africa (excluding high income)Middle East & North Africa (IDA & IBRD countries)Middle incomeMoldovaMongoliaMontenegroMoroccoMozambiqueMyanmarNamibiaNepalNetherlandsNew CaledoniaNew ZealandNicaraguaNigerNigeriaNorth AmericaNorwayOECD membersOmanOther small statesPacific island small statesPakistanPalauPanamaPapua New GuineaParaguayPeruPhilippinesPolandPortugalPost-demographic dividendPre-demographic dividendPuerto RicoQatarRomaniaRussian FederationRwandaSamoaSaudi ArabiaSenegalSerbiaSeychellesSierra LeoneSingaporeSlovak RepublicSloveniaSmall statesSolomon IslandsSomaliaSouth AfricaSouth AsiaSouth Asia (IDA & IBRD)South SudanSpainSri LankaSt. Kitts and NevisSt. LuciaSt. Vincent and the GrenadinesSub-Saharan Africa Sub-Saharan Africa (excluding high income)Sub-Saharan Africa (IDA & IBRD countries)SudanSurinameSwazilandSwedenSwitzerlandSyrian Arab RepublicTajikistanTanzaniaThailandTimor-LesteTogoTongaTrinidad and TobagoTunisiaTurkeyTurkmenistanUgandaUkraineUnited Arab EmiratesUnited KingdomUnited StatesUpper middle incomeUruguayUzbekistanVanuatuVenezuela, RBVietnamWest Bank and GazaWorldYemen, Rep.ZambiaZimbabwe Timeline:
This timeline shows a graph from 1961 to 2016 of Late-demographic dividend. No data until 1960. Number of actual observations by date: 56.
Source name:
World Development Indicators
Source organization:
World Bank national accounts data, and OECD National Accounts data files.
Categories, topics:
Economy & Growth, Trade
Last updated:
apr 23, 2017
Indicators value changes by year
Maximum:
38.329
jan 1, 2007
At the date of observation
Value
Absolute change
Change from previous value
jan 1, 1961
8.856
+8.856
0.0%
jan 1, 1962
8.422
-0.434
-4.9%
jan 1, 1963
7.587
-0.834
-9.9%
jan 1, 1964
8.378
+0.791
10.42%
jan 1, 1965
7.725
-0.653
-7.8%
jan 1, 1966
8.813
+1.089
14.09%
jan 1, 1967
8.551
-0.262
-2.97%
jan 1, 1968
8.193
-0.358
-4.19%
jan 1, 1969
8.562
+0.369
4.5%
jan 1, 1970
8.667
+0.104
1.22%
jan 1, 1971
8.254
-0.413
-4.77%
jan 1, 1972
8.086
-0.168
-2.03%
jan 1, 1973
8.502
+0.416
5.15%
jan 1, 1974
9.785
+1.283
15.09%
jan 1, 1975
11.167
+1.382
14.12%
jan 1, 1976
10.758
-0.409
-3.66%
jan 1, 1977
10.823
+0.065
0.6%
jan 1, 1978
10.712
-0.111
-1.02%
jan 1, 1979
10.68
-0.033
-0.31%
jan 1, 1980
11.595
+0.915
8.57%
jan 1, 1981
12.614
+1.019
8.79%
jan 1, 1982
13.209
+0.595
4.72%
jan 1, 1983
14.69
+1.481
11.21%
jan 1, 1984
14.659
-0.031
-0.21%
jan 1, 1985
15.313
+0.654
4.46%
jan 1, 1986
14.56
-0.754
-4.92%
jan 1, 1987
13.83
-0.729
-5.01%
jan 1, 1988
16.89
+3.06
22.13%
jan 1, 1989
18.567
+1.676
9.92%
jan 1, 1990
17.979
-0.587
-3.16%
jan 1, 1991
18.907
+0.928
5.16%
jan 1, 1992
18.682
-0.225
-1.19%
jan 1, 1993
26.531
+7.849
42.01%
jan 1, 1994
23.882
-2.649
-9.98%
jan 1, 1995
23.68
-0.202
-0.85%
jan 1, 1996
23.577
-0.102
-0.43%
jan 1, 1997
23.083
-0.494
-2.09%
jan 1, 1998
23.402
+0.318
1.38%
jan 1, 1999
24.868
+1.467
6.27%
jan 1, 2000
27.163
+2.295
9.23%
jan 1, 2001
29.534
+2.371
8.73%
jan 1, 2002
29.087
-0.447
-1.51%
jan 1, 2003
29.924
+0.837
2.88%
jan 1, 2004
32.7
+2.776
9.28%
jan 1, 2005
35.536
+2.836
8.67%
jan 1, 2006
37.096
+1.56
4.39%
jan 1, 2007
38.329
+1.233
3.32%
jan 1, 2008
37.155
-1.173
-3.06%
jan 1, 2009
35.714
-1.441
-3.88%
jan 1, 2010
30.31
-5.403
-15.13%
jan 1, 2011
32.124
+1.813
5.98%
jan 1, 2012
33.257
+1.133
3.53%
jan 1, 2013
32.978
-0.279
-0.84%
jan 1, 2014
32.328
-0.65
-1.97%
jan 1, 2015
31.962
-0.365
-1.13%
jan 1, 2016
31.181
-0.781
-2.44%
Ranking of countries by current statistics by years


Comments: