29
/
en
AIzaSyAYiBZKx7MnpbEhh9jyipgxe19OcubqV5w
April 1, 2024
194151
Mauritius
MUS
true
2
1
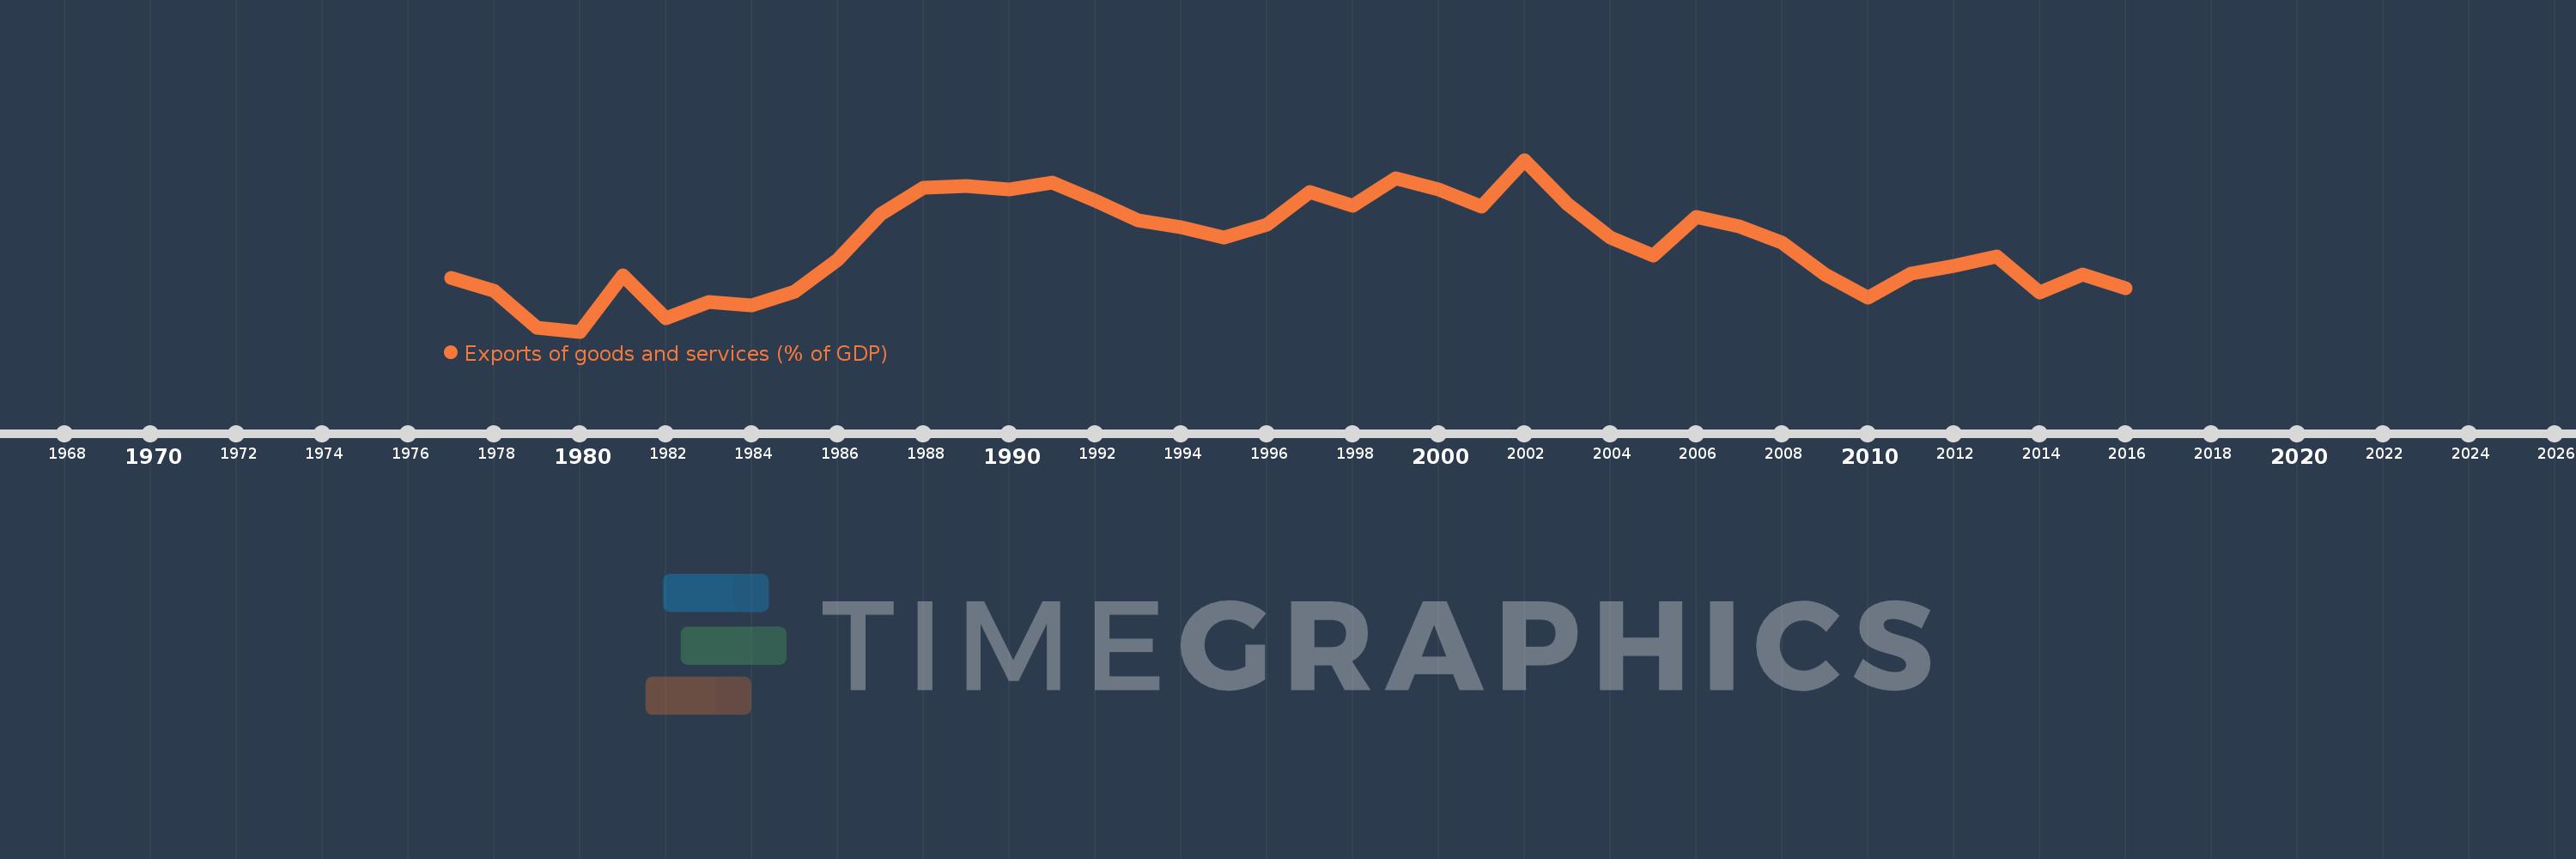
Exports of goods and services (% of GDP)
2016,2015,2014,2013,2012,2011,2010,2009,2008,2007,2006,2005,2004,2003,2002,2001,2000,1999,1998,1997,1996,1995,1994,1993,1992,1991,1990,1989,1988,1987,1986,1985,1984,1983,1982,1981,1980,1979,1978,1977
This statistics in other country:
AfghanistanAlbaniaAlgeriaAngolaAntigua and BarbudaArab WorldArgentinaArmeniaArubaAustraliaAustriaAzerbaijanBahamas, TheBahrainBangladeshBarbadosBelarusBelgiumBelizeBeninBermudaBhutanBoliviaBosnia and HerzegovinaBotswanaBrazilBrunei DarussalamBulgariaBurkina FasoBurundiCabo VerdeCambodiaCameroonCanadaCaribbean small statesCentral African RepublicCentral Europe and the BalticsChadChileChinaColombiaComorosCongo, Dem. Rep.Congo, Rep.Costa RicaCote d'IvoireCroatiaCubaCyprusCzech RepublicDenmarkDjiboutiDominicaDominican RepublicEarly-demographic dividendEast Asia & PacificEast Asia & Pacific (excluding high income)East Asia & Pacific (IDA & IBRD countries)EcuadorEgypt, Arab Rep.El SalvadorEquatorial GuineaEritreaEstoniaEthiopiaEuro areaEurope & Central AsiaEurope & Central Asia (excluding high income)Europe & Central Asia (IDA & IBRD countries)European UnionFaroe IslandsFijiFinlandFragile and conflict affected situationsFranceFrench PolynesiaGabonGambia, TheGeorgiaGermanyGhanaGreeceGrenadaGuatemalaGuineaGuinea-BissauGuyanaHaitiHeavily indebted poor countries (HIPC)High incomeHondurasHong Kong SAR, ChinaHungaryIBRD onlyIcelandIDA & IBRD totalIDA blendIDA onlyIDA totalIndiaIndonesiaIran, Islamic Rep.IraqIrelandIsraelItalyJamaicaJapanJordanKazakhstanKenyaKiribatiKorea, Rep.KosovoKuwaitKyrgyz RepublicLao PDRLate-demographic dividendLatin America & Caribbean Latin America & Caribbean (excluding high income)Latin America & the Caribbean (IDA & IBRD countries)LatviaLeast developed countries: UN classificationLebanonLesothoLiberiaLibyaLithuaniaLow & middle incomeLow incomeLower middle incomeLuxembourgMacao SAR, ChinaMacedonia, FYRMadagascarMalawiMalaysiaMaldivesMaliMaltaMauritaniaMauritiusMexicoMicronesia, Fed. Sts.Middle East & North AfricaMiddle East & North Africa (excluding high income)Middle East & North Africa (IDA & IBRD countries)Middle incomeMoldovaMongoliaMontenegroMoroccoMozambiqueMyanmarNamibiaNepalNetherlandsNew CaledoniaNew ZealandNicaraguaNigerNigeriaNorth AmericaNorwayOECD membersOmanOther small statesPacific island small statesPakistanPalauPanamaPapua New GuineaParaguayPeruPhilippinesPolandPortugalPost-demographic dividendPre-demographic dividendPuerto RicoQatarRomaniaRussian FederationRwandaSamoaSaudi ArabiaSenegalSerbiaSeychellesSierra LeoneSingaporeSlovak RepublicSloveniaSmall statesSolomon IslandsSomaliaSouth AfricaSouth AsiaSouth Asia (IDA & IBRD)South SudanSpainSri LankaSt. Kitts and NevisSt. LuciaSt. Vincent and the GrenadinesSub-Saharan Africa Sub-Saharan Africa (excluding high income)Sub-Saharan Africa (IDA & IBRD countries)SudanSurinameSwazilandSwedenSwitzerlandSyrian Arab RepublicTajikistanTanzaniaThailandTimor-LesteTogoTongaTrinidad and TobagoTunisiaTurkeyTurkmenistanUgandaUkraineUnited Arab EmiratesUnited KingdomUnited StatesUpper middle incomeUruguayUzbekistanVanuatuVenezuela, RBVietnamWest Bank and GazaWorldYemen, Rep.ZambiaZimbabwe Timeline:
This timeline shows a graph from 1977 to 2016 of Mauritius. No data until 1976. Number of actual observations by date: 40.
Source name:
World Development Indicators
Source organization:
World Bank national accounts data, and OECD National Accounts data files.
Categories, topics:
Economy & Growth, Trade
Last updated:
apr 23, 2017
Indicators value changes by year
Minimum:
42.492
jan 1, 1980
Maximum:
68.457
jan 1, 2002
At the date of observation
Value
Absolute change
Change from previous value
jan 1, 1977
50.553
+50.553
0.0%
jan 1, 1978
48.601
-1.952
-3.86%
jan 1, 1979
43.044
-5.558
-11.43%
jan 1, 1980
42.492
-0.552
-1.28%
jan 1, 1981
50.953
+8.461
19.91%
jan 1, 1982
44.538
-6.415
-12.59%
jan 1, 1983
46.958
+2.42
5.43%
jan 1, 1984
46.448
-0.511
-1.09%
jan 1, 1985
48.466
+2.019
4.35%
jan 1, 1986
53.302
+4.836
9.98%
jan 1, 1987
60.249
+6.947
13.03%
jan 1, 1988
64.295
+4.046
6.71%
jan 1, 1989
64.454
+0.159
0.25%
jan 1, 1990
63.935
-0.519
-0.81%
jan 1, 1991
64.957
+1.022
1.6%
jan 1, 1992
62.305
-2.652
-4.08%
jan 1, 1993
59.305
-3.001
-4.82%
jan 1, 1994
58.243
-1.062
-1.79%
jan 1, 1995
56.723
-1.52
-2.61%
jan 1, 1996
58.658
+1.935
3.41%
jan 1, 1997
63.586
+4.928
8.4%
jan 1, 1998
61.462
-2.123
-3.34%
jan 1, 1999
65.684
+4.222
6.87%
jan 1, 2000
63.935
-1.749
-2.66%
jan 1, 2001
61.386
-2.55
-3.99%
jan 1, 2002
68.457
+7.071
11.52%
jan 1, 2003
61.819
-6.638
-9.7%
jan 1, 2004
56.678
-5.141
-8.32%
jan 1, 2005
54.021
-2.657
-4.69%
jan 1, 2006
59.855
+5.834
10.8%
jan 1, 2007
58.444
-1.411
-2.36%
jan 1, 2008
55.867
-2.576
-4.41%
jan 1, 2009
51.071
-4.797
-8.59%
jan 1, 2010
47.677
-3.393
-6.64%
jan 1, 2011
51.238
+3.561
7.47%
jan 1, 2012
52.444
+1.206
2.35%
jan 1, 2013
53.792
+1.348
2.57%
jan 1, 2014
48.417
-5.375
-9.99%
jan 1, 2015
51.063
+2.645
5.46%
jan 1, 2016
49.039
-2.024
-3.96%
Ranking of countries by current statistics by years


Comments: