29
/
en
AIzaSyAYiBZKx7MnpbEhh9jyipgxe19OcubqV5w
April 1, 2024
247484
Spain
ESP
true
2
1
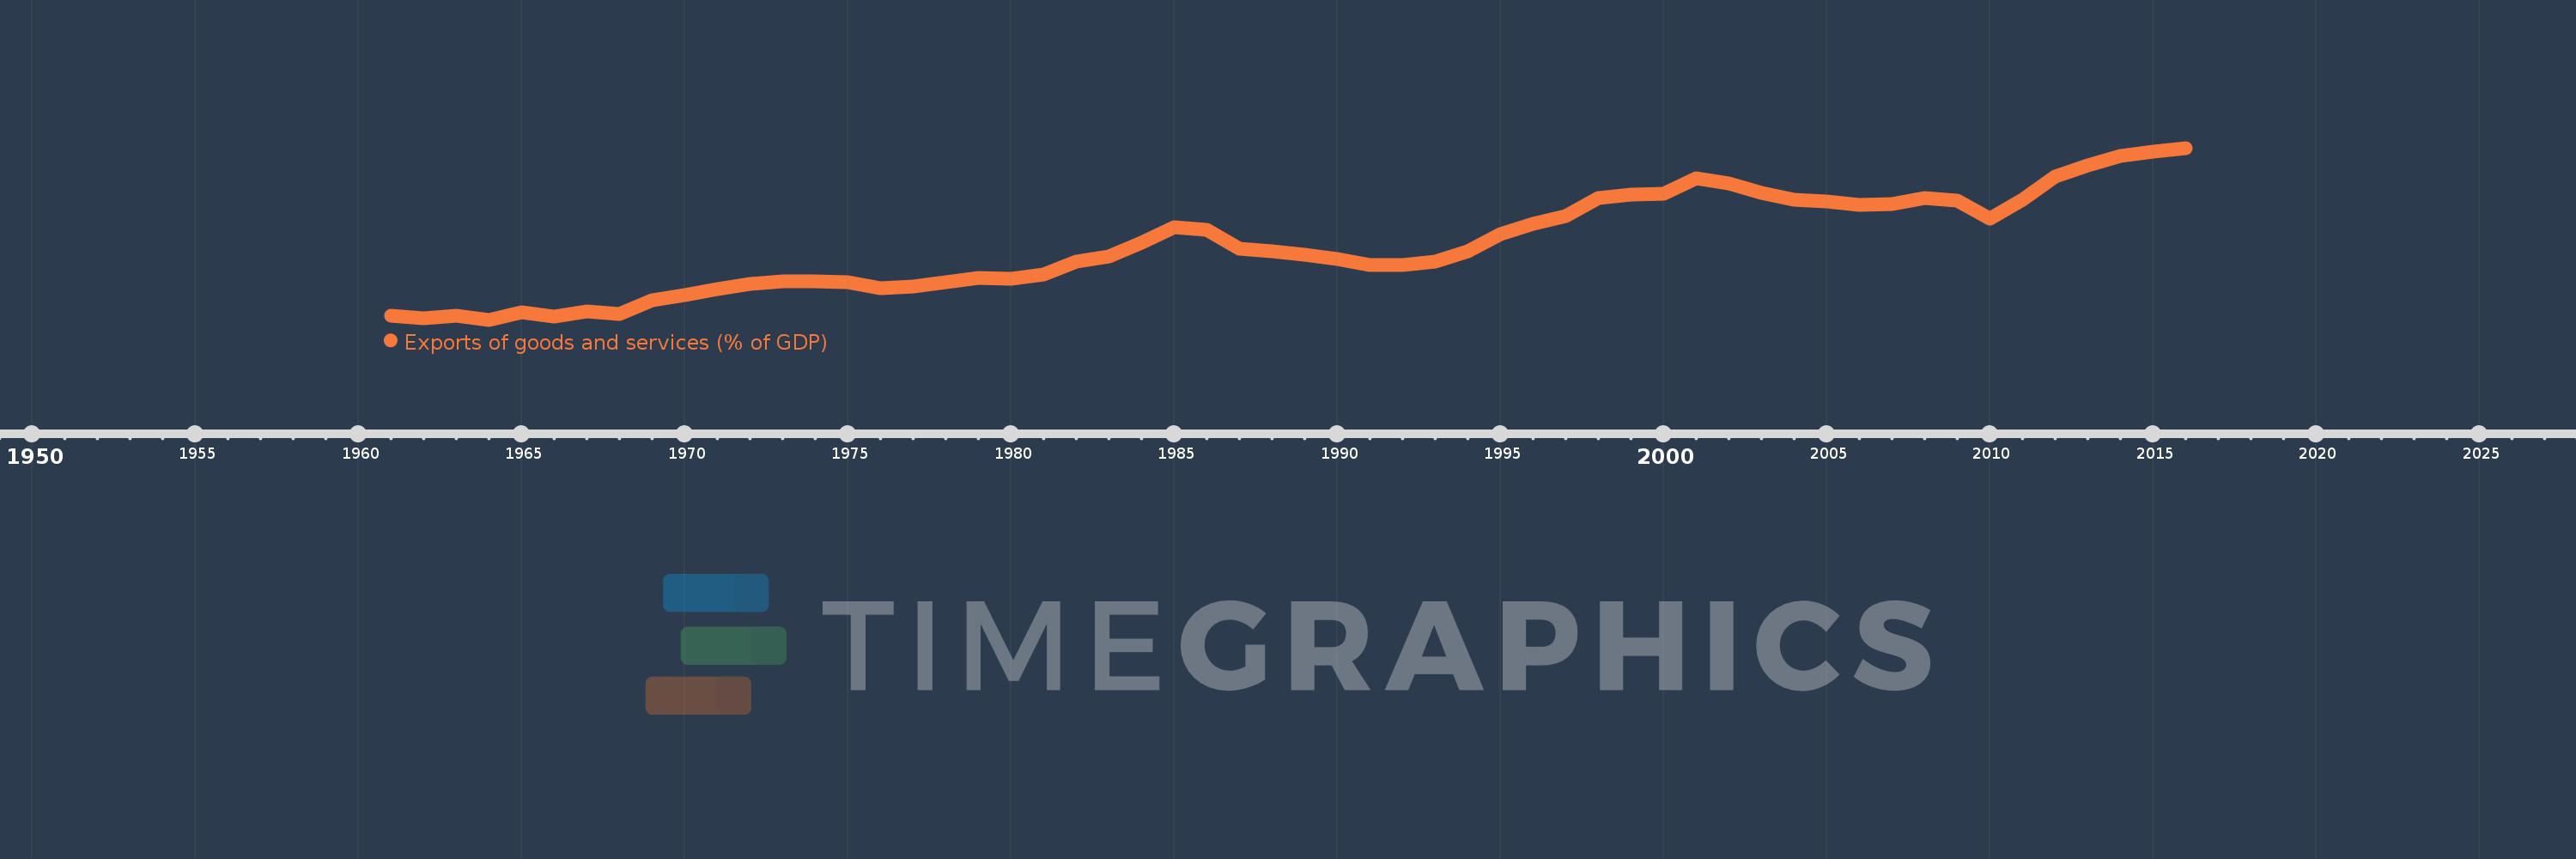
Exports of goods and services (% of GDP)
2016,2015,2014,2013,2012,2011,2010,2009,2008,2007,2006,2005,2004,2003,2002,2001,2000,1999,1998,1997,1996,1995,1994,1993,1992,1991,1990,1989,1988,1987,1986,1985,1984,1983,1982,1981,1980,1979,1978,1977,1976,1975,1974,1973,1972,1971,1970,1969,1968,1967,1966,1965,1964,1963,1962,1961
This statistics in other country:
AfghanistanAlbaniaAlgeriaAngolaAntigua and BarbudaArab WorldArgentinaArmeniaArubaAustraliaAustriaAzerbaijanBahamas, TheBahrainBangladeshBarbadosBelarusBelgiumBelizeBeninBermudaBhutanBoliviaBosnia and HerzegovinaBotswanaBrazilBrunei DarussalamBulgariaBurkina FasoBurundiCabo VerdeCambodiaCameroonCanadaCaribbean small statesCentral African RepublicCentral Europe and the BalticsChadChileChinaColombiaComorosCongo, Dem. Rep.Congo, Rep.Costa RicaCote d'IvoireCroatiaCubaCyprusCzech RepublicDenmarkDjiboutiDominicaDominican RepublicEarly-demographic dividendEast Asia & PacificEast Asia & Pacific (excluding high income)East Asia & Pacific (IDA & IBRD countries)EcuadorEgypt, Arab Rep.El SalvadorEquatorial GuineaEritreaEstoniaEthiopiaEuro areaEurope & Central AsiaEurope & Central Asia (excluding high income)Europe & Central Asia (IDA & IBRD countries)European UnionFaroe IslandsFijiFinlandFragile and conflict affected situationsFranceFrench PolynesiaGabonGambia, TheGeorgiaGermanyGhanaGreeceGrenadaGuatemalaGuineaGuinea-BissauGuyanaHaitiHeavily indebted poor countries (HIPC)High incomeHondurasHong Kong SAR, ChinaHungaryIBRD onlyIcelandIDA & IBRD totalIDA blendIDA onlyIDA totalIndiaIndonesiaIran, Islamic Rep.IraqIrelandIsraelItalyJamaicaJapanJordanKazakhstanKenyaKiribatiKorea, Rep.KosovoKuwaitKyrgyz RepublicLao PDRLate-demographic dividendLatin America & Caribbean Latin America & Caribbean (excluding high income)Latin America & the Caribbean (IDA & IBRD countries)LatviaLeast developed countries: UN classificationLebanonLesothoLiberiaLibyaLithuaniaLow & middle incomeLow incomeLower middle incomeLuxembourgMacao SAR, ChinaMacedonia, FYRMadagascarMalawiMalaysiaMaldivesMaliMaltaMauritaniaMauritiusMexicoMicronesia, Fed. Sts.Middle East & North AfricaMiddle East & North Africa (excluding high income)Middle East & North Africa (IDA & IBRD countries)Middle incomeMoldovaMongoliaMontenegroMoroccoMozambiqueMyanmarNamibiaNepalNetherlandsNew CaledoniaNew ZealandNicaraguaNigerNigeriaNorth AmericaNorwayOECD membersOmanOther small statesPacific island small statesPakistanPalauPanamaPapua New GuineaParaguayPeruPhilippinesPolandPortugalPost-demographic dividendPre-demographic dividendPuerto RicoQatarRomaniaRussian FederationRwandaSamoaSaudi ArabiaSenegalSerbiaSeychellesSierra LeoneSingaporeSlovak RepublicSloveniaSmall statesSolomon IslandsSomaliaSouth AfricaSouth AsiaSouth Asia (IDA & IBRD)South SudanSpainSri LankaSt. Kitts and NevisSt. LuciaSt. Vincent and the GrenadinesSub-Saharan Africa Sub-Saharan Africa (excluding high income)Sub-Saharan Africa (IDA & IBRD countries)SudanSurinameSwazilandSwedenSwitzerlandSyrian Arab RepublicTajikistanTanzaniaThailandTimor-LesteTogoTongaTrinidad and TobagoTunisiaTurkeyTurkmenistanUgandaUkraineUnited Arab EmiratesUnited KingdomUnited StatesUpper middle incomeUruguayUzbekistanVanuatuVenezuela, RBVietnamWest Bank and GazaWorldYemen, Rep.ZambiaZimbabwe Timeline:
This timeline shows a graph from 1961 to 2016 of Spain. No data until 1960. Number of actual observations by date: 56.
Source name:
World Development Indicators
Source organization:
World Bank national accounts data, and OECD National Accounts data files.
Categories, topics:
Economy & Growth, Trade
Last updated:
apr 23, 2017
Indicators value changes by year
Maximum:
33.148
jan 1, 2016
At the date of observation
Value
Absolute change
Change from previous value
jan 1, 1961
8.367
+8.367
0.0%
jan 1, 1962
7.972
-0.394
-4.71%
jan 1, 1963
8.304
+0.331
4.16%
jan 1, 1964
7.712
-0.591
-7.12%
jan 1, 1965
8.812
+1.099
14.26%
jan 1, 1966
8.193
-0.619
-7.02%
jan 1, 1967
8.893
+0.7
8.54%
jan 1, 1968
8.551
-0.342
-3.84%
jan 1, 1969
10.569
+2.017
23.59%
jan 1, 1970
11.333
+0.764
7.23%
jan 1, 1971
12.189
+0.856
7.55%
jan 1, 1972
13.076
+0.887
7.28%
jan 1, 1973
13.403
+0.327
2.5%
jan 1, 1974
13.385
-0.018
-0.13%
jan 1, 1975
13.248
-0.138
-1.03%
jan 1, 1976
12.435
-0.813
-6.13%
jan 1, 1977
12.627
+0.192
1.54%
jan 1, 1978
13.315
+0.688
5.45%
jan 1, 1979
13.946
+0.631
4.74%
jan 1, 1980
13.77
-0.176
-1.26%
jan 1, 1981
14.359
+0.589
4.28%
jan 1, 1982
16.362
+2.002
13.94%
jan 1, 1983
17.059
+0.697
4.26%
jan 1, 1984
19.167
+2.108
12.36%
jan 1, 1985
21.405
+2.238
11.68%
jan 1, 1986
20.965
-0.44
-2.06%
jan 1, 1987
18.285
-2.68
-12.78%
jan 1, 1988
17.81
-0.475
-2.6%
jan 1, 1989
17.386
-0.424
-2.38%
jan 1, 1990
16.682
-0.704
-4.05%
jan 1, 1991
15.8
-0.882
-5.29%
jan 1, 1992
15.836
+0.036
0.23%
jan 1, 1993
16.265
+0.429
2.71%
jan 1, 1994
17.794
+1.529
9.4%
jan 1, 1995
20.409
+2.615
14.69%
jan 1, 1996
21.932
+1.523
7.46%
jan 1, 1997
23.118
+1.187
5.41%
jan 1, 1998
25.754
+2.635
11.4%
jan 1, 1999
26.183
+0.429
1.67%
jan 1, 2000
26.397
+0.214
0.82%
jan 1, 2001
28.616
+2.219
8.41%
jan 1, 2002
27.862
-0.754
-2.63%
jan 1, 2003
26.477
-1.385
-4.97%
jan 1, 2004
25.447
-1.03
-3.89%
jan 1, 2005
25.179
-0.268
-1.05%
jan 1, 2006
24.668
-0.511
-2.03%
jan 1, 2007
24.872
+0.204
0.83%
jan 1, 2008
25.708
+0.836
3.36%
jan 1, 2009
25.317
-0.391
-1.52%
jan 1, 2010
22.674
-2.643
-10.44%
jan 1, 2011
25.52
+2.846
12.55%
jan 1, 2012
28.921
+3.401
13.33%
jan 1, 2013
30.61
+1.689
5.84%
jan 1, 2014
31.955
+1.345
4.39%
jan 1, 2015
32.545
+0.59
1.85%
jan 1, 2016
33.148
+0.603
1.85%
Ranking of countries by current statistics by years


Comments: