29
/
en
AIzaSyAYiBZKx7MnpbEhh9jyipgxe19OcubqV5w
April 1, 2024
188962
Maldives
MDV
true
2
1
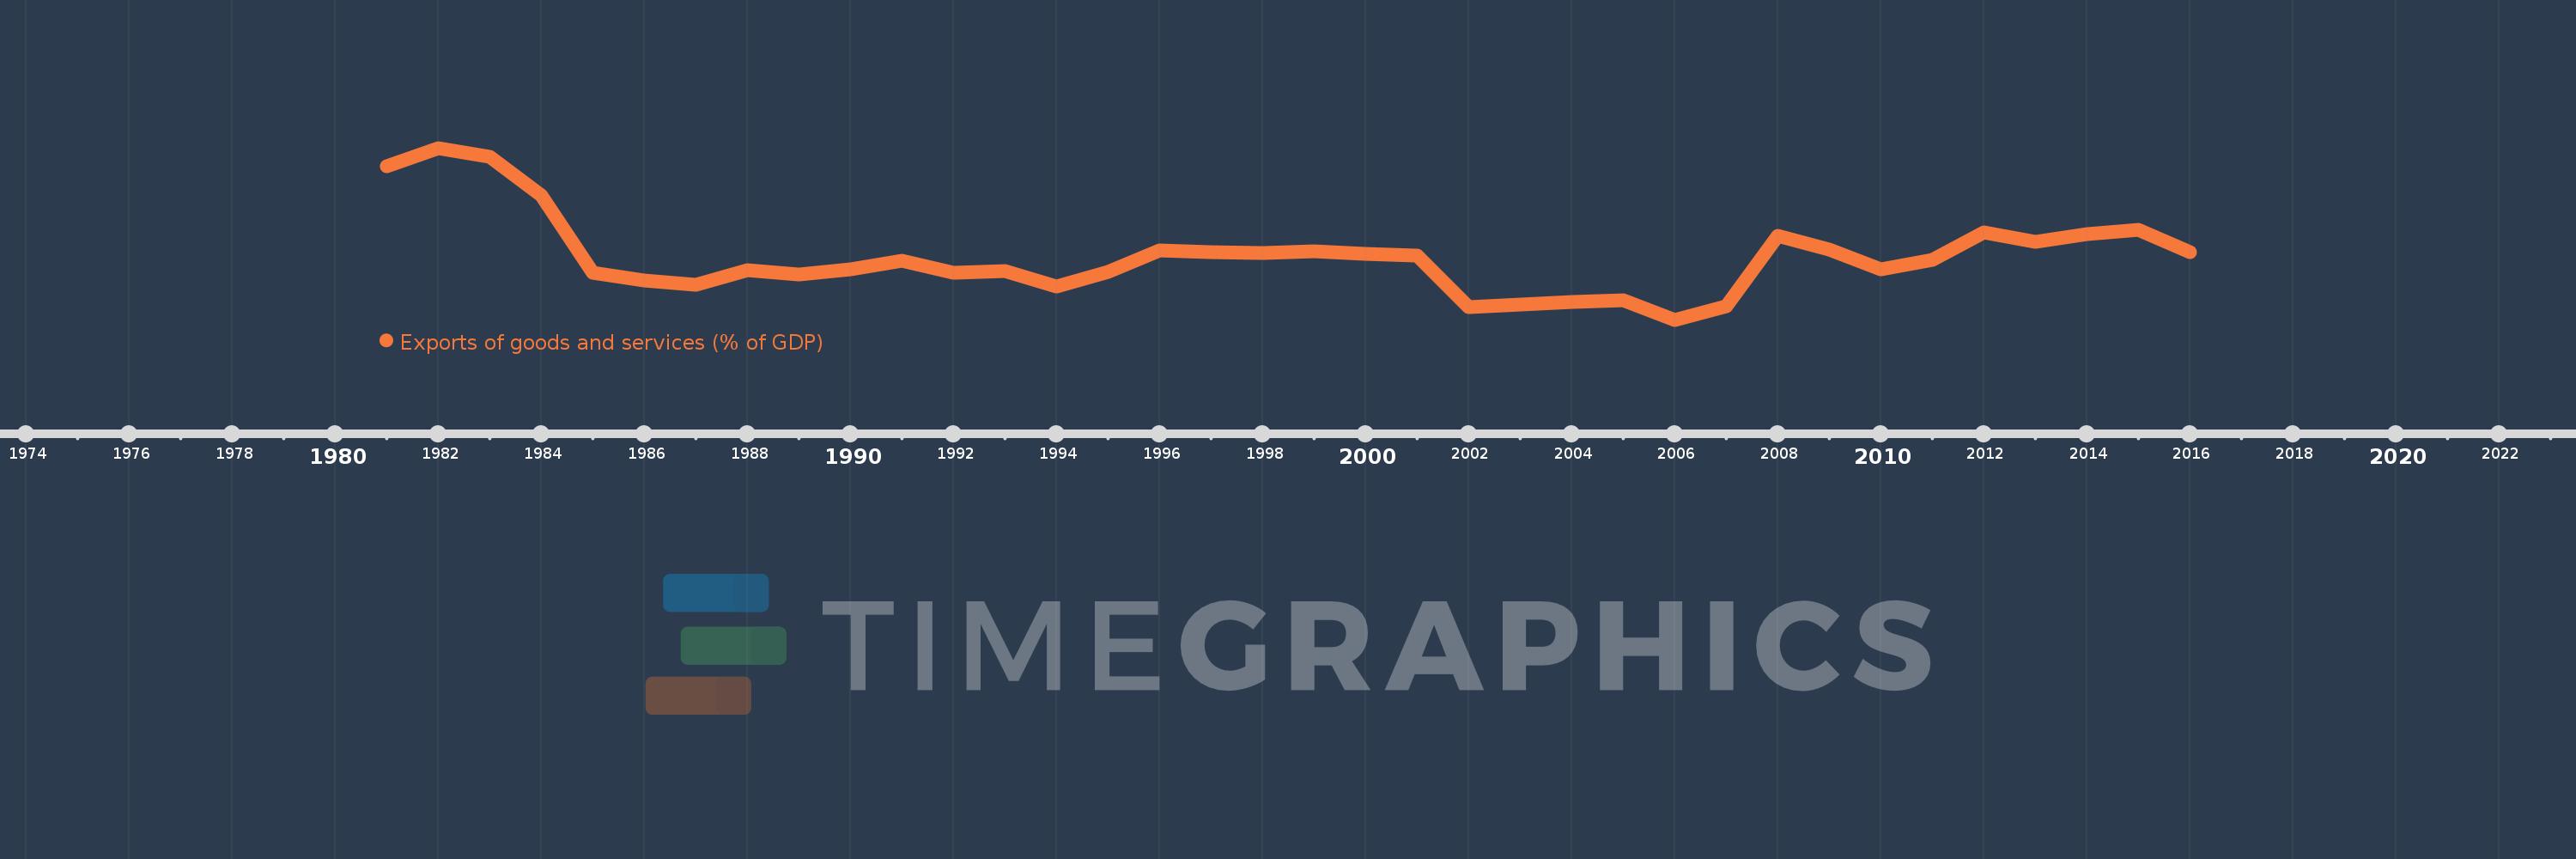
Exports of goods and services (% of GDP)
2016,2015,2014,2013,2012,2011,2010,2009,2008,2007,2006,2005,2004,2003,2002,2001,2000,1999,1998,1997,1996,1995,1994,1993,1992,1991,1990,1989,1988,1987,1986,1985,1984,1983,1982,1981
This statistics in other country:
AfghanistanAlbaniaAlgeriaAngolaAntigua and BarbudaArab WorldArgentinaArmeniaArubaAustraliaAustriaAzerbaijanBahamas, TheBahrainBangladeshBarbadosBelarusBelgiumBelizeBeninBermudaBhutanBoliviaBosnia and HerzegovinaBotswanaBrazilBrunei DarussalamBulgariaBurkina FasoBurundiCabo VerdeCambodiaCameroonCanadaCaribbean small statesCentral African RepublicCentral Europe and the BalticsChadChileChinaColombiaComorosCongo, Dem. Rep.Congo, Rep.Costa RicaCote d'IvoireCroatiaCubaCyprusCzech RepublicDenmarkDjiboutiDominicaDominican RepublicEarly-demographic dividendEast Asia & PacificEast Asia & Pacific (excluding high income)East Asia & Pacific (IDA & IBRD countries)EcuadorEgypt, Arab Rep.El SalvadorEquatorial GuineaEritreaEstoniaEthiopiaEuro areaEurope & Central AsiaEurope & Central Asia (excluding high income)Europe & Central Asia (IDA & IBRD countries)European UnionFaroe IslandsFijiFinlandFragile and conflict affected situationsFranceFrench PolynesiaGabonGambia, TheGeorgiaGermanyGhanaGreeceGrenadaGuatemalaGuineaGuinea-BissauGuyanaHaitiHeavily indebted poor countries (HIPC)High incomeHondurasHong Kong SAR, ChinaHungaryIBRD onlyIcelandIDA & IBRD totalIDA blendIDA onlyIDA totalIndiaIndonesiaIran, Islamic Rep.IraqIrelandIsraelItalyJamaicaJapanJordanKazakhstanKenyaKiribatiKorea, Rep.KosovoKuwaitKyrgyz RepublicLao PDRLate-demographic dividendLatin America & Caribbean Latin America & Caribbean (excluding high income)Latin America & the Caribbean (IDA & IBRD countries)LatviaLeast developed countries: UN classificationLebanonLesothoLiberiaLibyaLithuaniaLow & middle incomeLow incomeLower middle incomeLuxembourgMacao SAR, ChinaMacedonia, FYRMadagascarMalawiMalaysiaMaldivesMaliMaltaMauritaniaMauritiusMexicoMicronesia, Fed. Sts.Middle East & North AfricaMiddle East & North Africa (excluding high income)Middle East & North Africa (IDA & IBRD countries)Middle incomeMoldovaMongoliaMontenegroMoroccoMozambiqueMyanmarNamibiaNepalNetherlandsNew CaledoniaNew ZealandNicaraguaNigerNigeriaNorth AmericaNorwayOECD membersOmanOther small statesPacific island small statesPakistanPalauPanamaPapua New GuineaParaguayPeruPhilippinesPolandPortugalPost-demographic dividendPre-demographic dividendPuerto RicoQatarRomaniaRussian FederationRwandaSamoaSaudi ArabiaSenegalSerbiaSeychellesSierra LeoneSingaporeSlovak RepublicSloveniaSmall statesSolomon IslandsSomaliaSouth AfricaSouth AsiaSouth Asia (IDA & IBRD)South SudanSpainSri LankaSt. Kitts and NevisSt. LuciaSt. Vincent and the GrenadinesSub-Saharan Africa Sub-Saharan Africa (excluding high income)Sub-Saharan Africa (IDA & IBRD countries)SudanSurinameSwazilandSwedenSwitzerlandSyrian Arab RepublicTajikistanTanzaniaThailandTimor-LesteTogoTongaTrinidad and TobagoTunisiaTurkeyTurkmenistanUgandaUkraineUnited Arab EmiratesUnited KingdomUnited StatesUpper middle incomeUruguayUzbekistanVanuatuVenezuela, RBVietnamWest Bank and GazaWorldYemen, Rep.ZambiaZimbabwe Timeline:
This timeline shows a graph from 1981 to 2016 of Maldives. No data until 1980. Number of actual observations by date: 36.
Source name:
World Development Indicators
Source organization:
World Bank national accounts data, and OECD National Accounts data files.
Categories, topics:
Economy & Growth, Trade
Last updated:
apr 23, 2017
Indicators value changes by year
Minimum:
43.269
jan 1, 2006
Maximum:
166.364
jan 1, 1982
At the date of observation
Value
Absolute change
Change from previous value
jan 1, 1981
153.543
+153.543
0.0%
jan 1, 1982
166.364
+12.82
8.35%
jan 1, 1983
159.797
-6.567
-3.95%
jan 1, 1984
132.631
-27.166
-17.0%
jan 1, 1985
77.166
-55.464
-41.82%
jan 1, 1986
71.645
-5.522
-7.16%
jan 1, 1987
68.075
-3.57
-4.98%
jan 1, 1988
78.715
+10.64
15.63%
jan 1, 1989
75.855
-2.86
-3.63%
jan 1, 1990
79.194
+3.338
4.4%
jan 1, 1991
85.453
+6.259
7.9%
jan 1, 1992
76.93
-8.523
-9.97%
jan 1, 1993
78.027
+1.097
1.43%
jan 1, 1994
67.129
-10.898
-13.97%
jan 1, 1995
77.736
+10.607
15.8%
jan 1, 1996
92.658
+14.922
19.2%
jan 1, 1997
91.713
-0.945
-1.02%
jan 1, 1998
91.223
-0.49
-0.53%
jan 1, 1999
92.431
+1.208
1.32%
jan 1, 2000
90.506
-1.925
-2.08%
jan 1, 2001
89.473
-1.033
-1.14%
jan 1, 2002
52.507
-36.966
-41.31%
jan 1, 2003
54.378
+1.871
3.56%
jan 1, 2004
55.962
+1.583
2.91%
jan 1, 2005
57.276
+1.314
2.35%
jan 1, 2006
43.269
-14.007
-24.45%
jan 1, 2007
52.696
+9.427
21.79%
jan 1, 2008
103.315
+50.619
96.06%
jan 1, 2009
93.355
-9.96
-9.64%
jan 1, 2010
79.665
-13.69
-14.66%
jan 1, 2011
86.401
+6.736
8.46%
jan 1, 2012
105.589
+19.188
22.21%
jan 1, 2013
99.04
-6.549
-6.2%
jan 1, 2014
104.804
+5.764
5.82%
jan 1, 2015
107.684
+2.88
2.75%
jan 1, 2016
91.695
-15.989
-14.85%
Ranking of countries by current statistics by years


Comments: