29
/
en
AIzaSyAYiBZKx7MnpbEhh9jyipgxe19OcubqV5w
April 1, 2024
257251
Switzerland
CHE
true
2
1
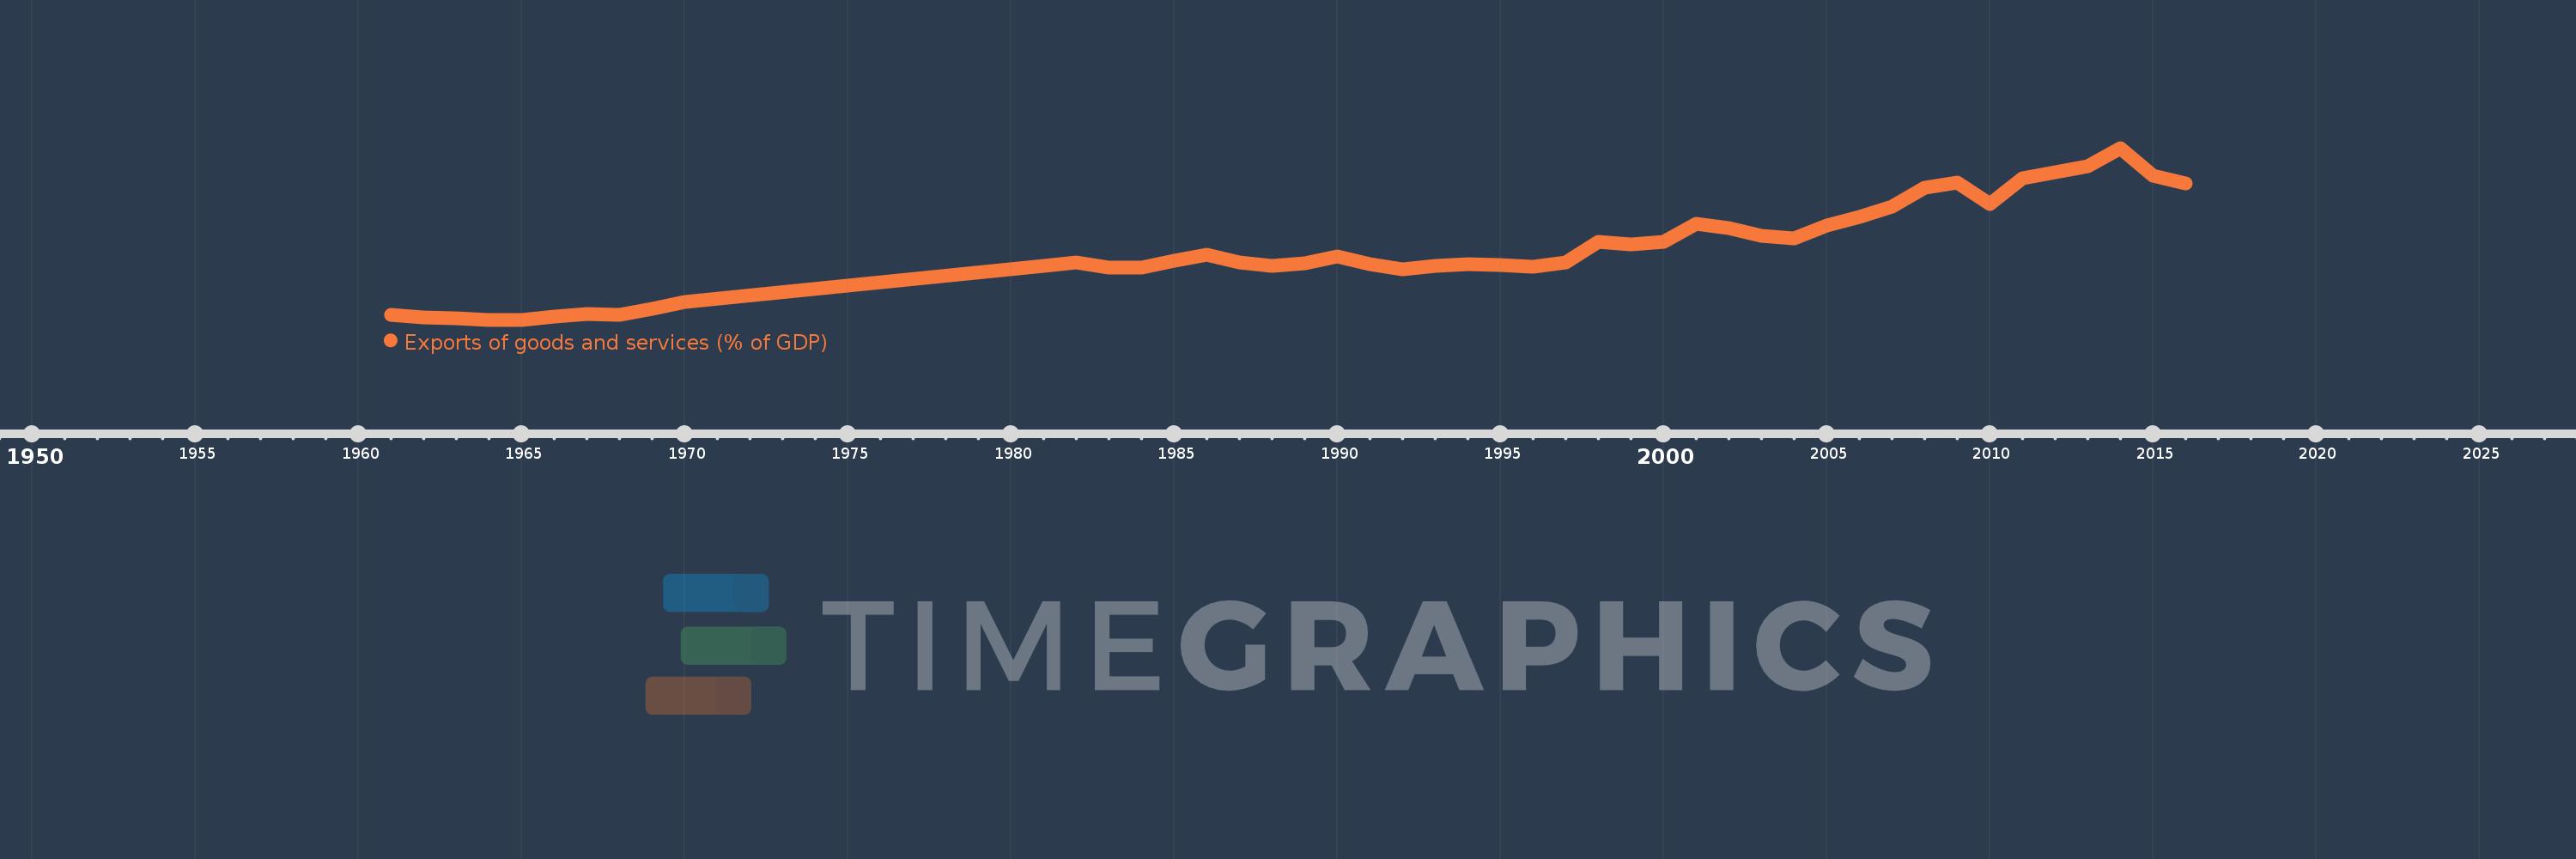
Exports of goods and services (% of GDP)
2016,2015,2014,2013,2012,2011,2010,2009,2008,2007,2006,2005,2004,2003,2002,2001,2000,1999,1998,1997,1996,1995,1994,1993,1992,1991,1990,1989,1988,1987,1986,1985,1984,1983,1982,1981,1970,1969,1968,1967,1966,1965,1964,1963,1962,1961
This statistics in other country:
AfghanistanAlbaniaAlgeriaAngolaAntigua and BarbudaArab WorldArgentinaArmeniaArubaAustraliaAustriaAzerbaijanBahamas, TheBahrainBangladeshBarbadosBelarusBelgiumBelizeBeninBermudaBhutanBoliviaBosnia and HerzegovinaBotswanaBrazilBrunei DarussalamBulgariaBurkina FasoBurundiCabo VerdeCambodiaCameroonCanadaCaribbean small statesCentral African RepublicCentral Europe and the BalticsChadChileChinaColombiaComorosCongo, Dem. Rep.Congo, Rep.Costa RicaCote d'IvoireCroatiaCubaCyprusCzech RepublicDenmarkDjiboutiDominicaDominican RepublicEarly-demographic dividendEast Asia & PacificEast Asia & Pacific (excluding high income)East Asia & Pacific (IDA & IBRD countries)EcuadorEgypt, Arab Rep.El SalvadorEquatorial GuineaEritreaEstoniaEthiopiaEuro areaEurope & Central AsiaEurope & Central Asia (excluding high income)Europe & Central Asia (IDA & IBRD countries)European UnionFaroe IslandsFijiFinlandFragile and conflict affected situationsFranceFrench PolynesiaGabonGambia, TheGeorgiaGermanyGhanaGreeceGrenadaGuatemalaGuineaGuinea-BissauGuyanaHaitiHeavily indebted poor countries (HIPC)High incomeHondurasHong Kong SAR, ChinaHungaryIBRD onlyIcelandIDA & IBRD totalIDA blendIDA onlyIDA totalIndiaIndonesiaIran, Islamic Rep.IraqIrelandIsraelItalyJamaicaJapanJordanKazakhstanKenyaKiribatiKorea, Rep.KosovoKuwaitKyrgyz RepublicLao PDRLate-demographic dividendLatin America & Caribbean Latin America & Caribbean (excluding high income)Latin America & the Caribbean (IDA & IBRD countries)LatviaLeast developed countries: UN classificationLebanonLesothoLiberiaLibyaLithuaniaLow & middle incomeLow incomeLower middle incomeLuxembourgMacao SAR, ChinaMacedonia, FYRMadagascarMalawiMalaysiaMaldivesMaliMaltaMauritaniaMauritiusMexicoMicronesia, Fed. Sts.Middle East & North AfricaMiddle East & North Africa (excluding high income)Middle East & North Africa (IDA & IBRD countries)Middle incomeMoldovaMongoliaMontenegroMoroccoMozambiqueMyanmarNamibiaNepalNetherlandsNew CaledoniaNew ZealandNicaraguaNigerNigeriaNorth AmericaNorwayOECD membersOmanOther small statesPacific island small statesPakistanPalauPanamaPapua New GuineaParaguayPeruPhilippinesPolandPortugalPost-demographic dividendPre-demographic dividendPuerto RicoQatarRomaniaRussian FederationRwandaSamoaSaudi ArabiaSenegalSerbiaSeychellesSierra LeoneSingaporeSlovak RepublicSloveniaSmall statesSolomon IslandsSomaliaSouth AfricaSouth AsiaSouth Asia (IDA & IBRD)South SudanSpainSri LankaSt. Kitts and NevisSt. LuciaSt. Vincent and the GrenadinesSub-Saharan Africa Sub-Saharan Africa (excluding high income)Sub-Saharan Africa (IDA & IBRD countries)SudanSurinameSwazilandSwedenSwitzerlandSyrian Arab RepublicTajikistanTanzaniaThailandTimor-LesteTogoTongaTrinidad and TobagoTunisiaTurkeyTurkmenistanUgandaUkraineUnited Arab EmiratesUnited KingdomUnited StatesUpper middle incomeUruguayUzbekistanVanuatuVenezuela, RBVietnamWest Bank and GazaWorldYemen, Rep.ZambiaZimbabwe Timeline:
This timeline shows a graph from 1961 to 2016 of Switzerland. No data until 1960. Number of actual observations by date: 46.
Source name:
World Development Indicators
Source organization:
World Bank national accounts data, and OECD National Accounts data files.
Categories, topics:
Economy & Growth, Trade
Last updated:
apr 23, 2017
Indicators value changes by year
Minimum:
26.573
jan 1, 1965
Maximum:
72.306
jan 1, 2014
At the date of observation
Value
Absolute change
Change from previous value
jan 1, 1961
27.77
+27.77
0.0%
jan 1, 1962
27.187
-0.583
-2.1%
jan 1, 1963
26.863
-0.324
-1.19%
jan 1, 1964
26.618
-0.244
-0.91%
jan 1, 1965
26.573
-0.046
-0.17%
jan 1, 1966
27.511
+0.938
3.53%
jan 1, 1967
28.139
+0.628
2.28%
jan 1, 1968
27.889
-0.25
-0.89%
jan 1, 1969
29.527
+1.638
5.87%
jan 1, 1970
31.32
+1.793
6.07%
jan 1, 1981
40.828
+9.508
30.36%
jan 1, 1982
41.835
+1.008
2.47%
jan 1, 1983
40.459
-1.376
-3.29%
jan 1, 1984
40.399
-0.06
-0.15%
jan 1, 1985
42.343
+1.944
4.81%
jan 1, 1986
43.938
+1.595
3.77%
jan 1, 1987
41.734
-2.204
-5.02%
jan 1, 1988
40.832
-0.902
-2.16%
jan 1, 1989
41.675
+0.843
2.06%
jan 1, 1990
43.416
+1.741
4.18%
jan 1, 1991
41.31
-2.106
-4.85%
jan 1, 1992
40.095
-1.215
-2.94%
jan 1, 1993
40.914
+0.819
2.04%
jan 1, 1994
41.459
+0.544
1.33%
jan 1, 1995
41.132
-0.327
-0.79%
jan 1, 1996
40.783
-0.349
-0.85%
jan 1, 1997
41.799
+1.015
2.49%
jan 1, 1998
47.227
+5.428
12.99%
jan 1, 1999
46.711
-0.516
-1.09%
jan 1, 2000
47.417
+0.706
1.51%
jan 1, 2001
52.192
+4.775
10.07%
jan 1, 2002
50.889
-1.304
-2.5%
jan 1, 2003
48.983
-1.906
-3.75%
jan 1, 2004
48.231
-0.752
-1.53%
jan 1, 2005
51.552
+3.321
6.89%
jan 1, 2006
53.943
+2.39
4.64%
jan 1, 2007
56.718
+2.775
5.15%
jan 1, 2008
61.625
+4.907
8.65%
jan 1, 2009
62.981
+1.355
2.2%
jan 1, 2010
57.44
-5.541
-8.8%
jan 1, 2011
64.249
+6.809
11.85%
jan 1, 2012
65.775
+1.526
2.38%
jan 1, 2013
67.338
+1.563
2.38%
jan 1, 2014
72.306
+4.968
7.38%
jan 1, 2015
64.863
-7.443
-10.29%
jan 1, 2016
62.903
-1.96
-3.02%
Ranking of countries by current statistics by years


Comments: