29
/
en
AIzaSyAYiBZKx7MnpbEhh9jyipgxe19OcubqV5w
April 1, 2024
28070
East Asia & Pacific (excluding high income)
EAP
false
2
1
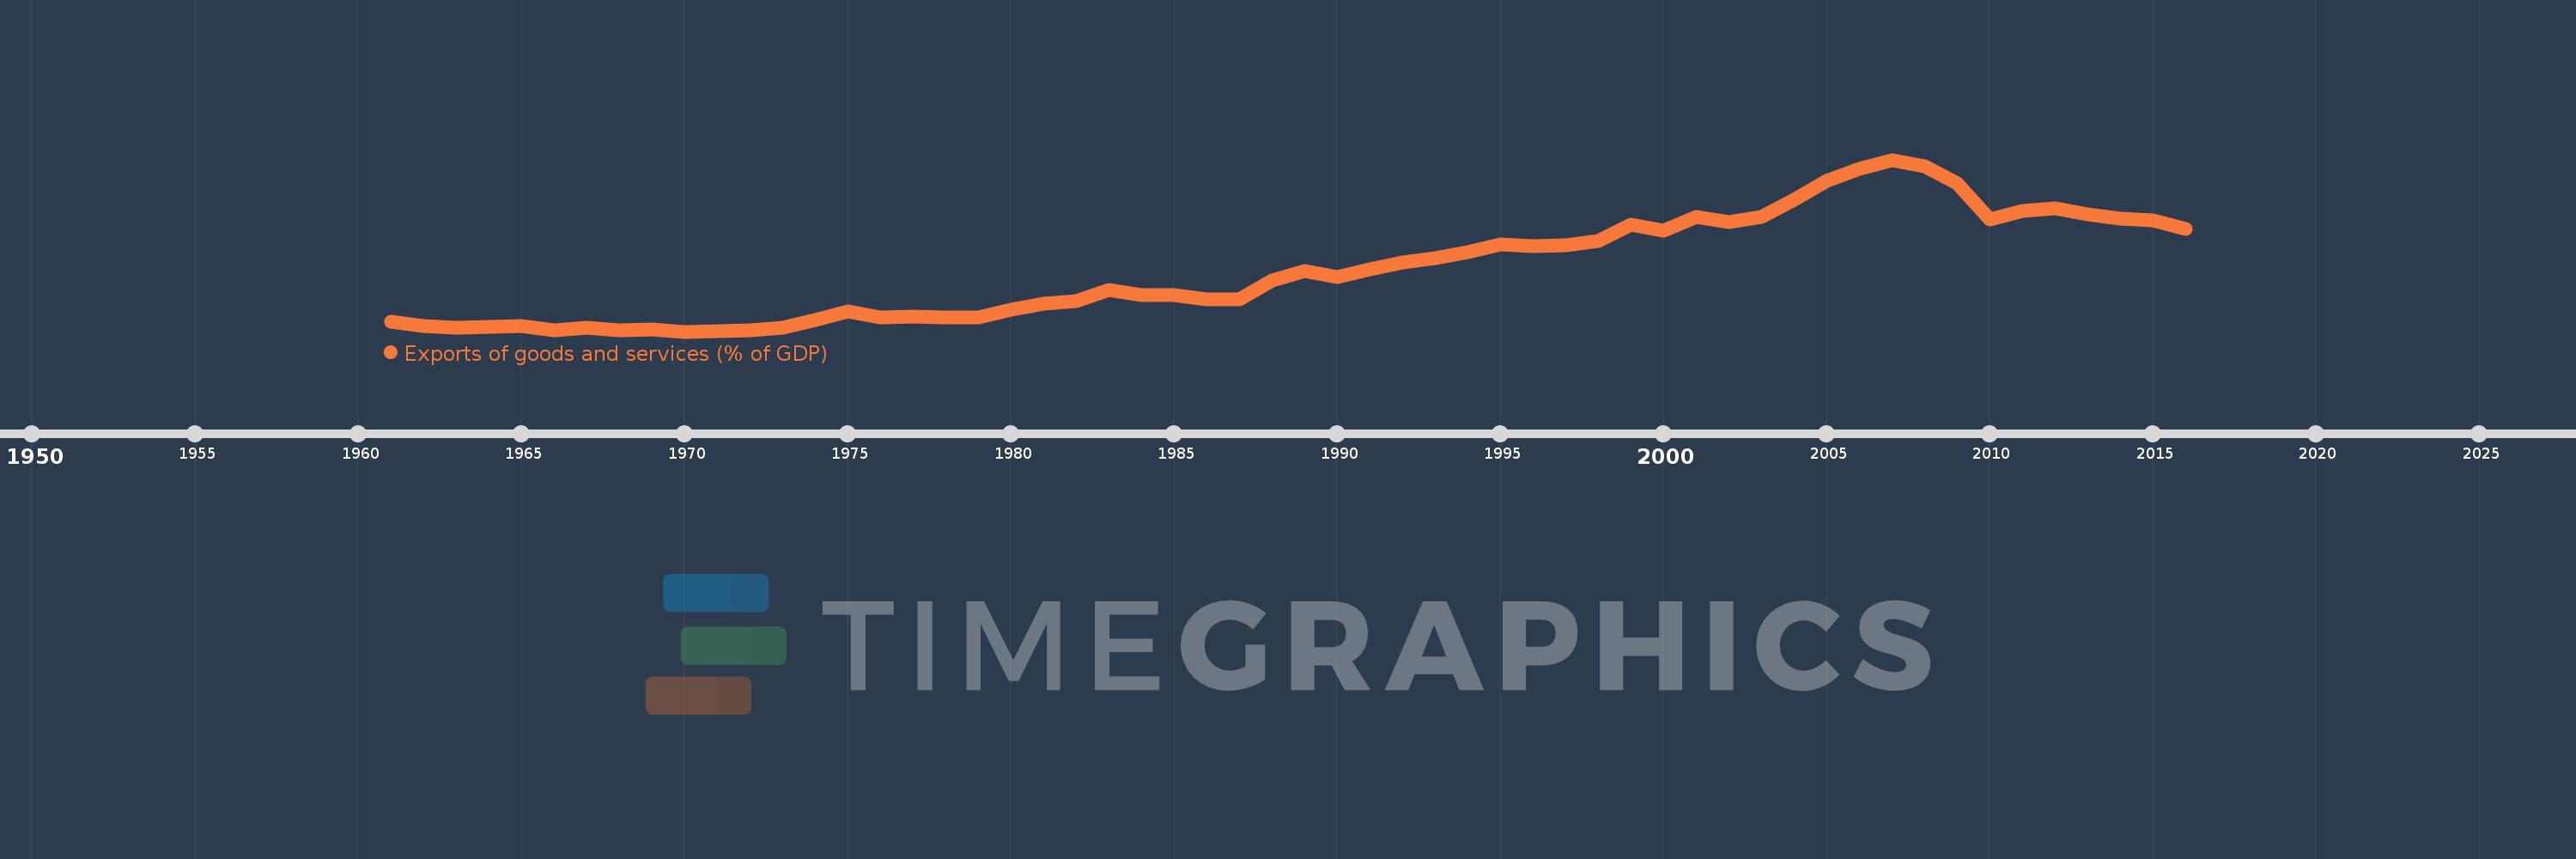
Exports of goods and services (% of GDP)
2016,2015,2014,2013,2012,2011,2010,2009,2008,2007,2006,2005,2004,2003,2002,2001,2000,1999,1998,1997,1996,1995,1994,1993,1992,1991,1990,1989,1988,1987,1986,1985,1984,1983,1982,1981,1980,1979,1978,1977,1976,1975,1974,1973,1972,1971,1970,1969,1968,1967,1966,1965,1964,1963,1962,1961
This statistics in other country:
AfghanistanAlbaniaAlgeriaAngolaAntigua and BarbudaArab WorldArgentinaArmeniaArubaAustraliaAustriaAzerbaijanBahamas, TheBahrainBangladeshBarbadosBelarusBelgiumBelizeBeninBermudaBhutanBoliviaBosnia and HerzegovinaBotswanaBrazilBrunei DarussalamBulgariaBurkina FasoBurundiCabo VerdeCambodiaCameroonCanadaCaribbean small statesCentral African RepublicCentral Europe and the BalticsChadChileChinaColombiaComorosCongo, Dem. Rep.Congo, Rep.Costa RicaCote d'IvoireCroatiaCubaCyprusCzech RepublicDenmarkDjiboutiDominicaDominican RepublicEarly-demographic dividendEast Asia & PacificEast Asia & Pacific (excluding high income)East Asia & Pacific (IDA & IBRD countries)EcuadorEgypt, Arab Rep.El SalvadorEquatorial GuineaEritreaEstoniaEthiopiaEuro areaEurope & Central AsiaEurope & Central Asia (excluding high income)Europe & Central Asia (IDA & IBRD countries)European UnionFaroe IslandsFijiFinlandFragile and conflict affected situationsFranceFrench PolynesiaGabonGambia, TheGeorgiaGermanyGhanaGreeceGrenadaGuatemalaGuineaGuinea-BissauGuyanaHaitiHeavily indebted poor countries (HIPC)High incomeHondurasHong Kong SAR, ChinaHungaryIBRD onlyIcelandIDA & IBRD totalIDA blendIDA onlyIDA totalIndiaIndonesiaIran, Islamic Rep.IraqIrelandIsraelItalyJamaicaJapanJordanKazakhstanKenyaKiribatiKorea, Rep.KosovoKuwaitKyrgyz RepublicLao PDRLate-demographic dividendLatin America & Caribbean Latin America & Caribbean (excluding high income)Latin America & the Caribbean (IDA & IBRD countries)LatviaLeast developed countries: UN classificationLebanonLesothoLiberiaLibyaLithuaniaLow & middle incomeLow incomeLower middle incomeLuxembourgMacao SAR, ChinaMacedonia, FYRMadagascarMalawiMalaysiaMaldivesMaliMaltaMauritaniaMauritiusMexicoMicronesia, Fed. Sts.Middle East & North AfricaMiddle East & North Africa (excluding high income)Middle East & North Africa (IDA & IBRD countries)Middle incomeMoldovaMongoliaMontenegroMoroccoMozambiqueMyanmarNamibiaNepalNetherlandsNew CaledoniaNew ZealandNicaraguaNigerNigeriaNorth AmericaNorwayOECD membersOmanOther small statesPacific island small statesPakistanPalauPanamaPapua New GuineaParaguayPeruPhilippinesPolandPortugalPost-demographic dividendPre-demographic dividendPuerto RicoQatarRomaniaRussian FederationRwandaSamoaSaudi ArabiaSenegalSerbiaSeychellesSierra LeoneSingaporeSlovak RepublicSloveniaSmall statesSolomon IslandsSomaliaSouth AfricaSouth AsiaSouth Asia (IDA & IBRD)South SudanSpainSri LankaSt. Kitts and NevisSt. LuciaSt. Vincent and the GrenadinesSub-Saharan Africa Sub-Saharan Africa (excluding high income)Sub-Saharan Africa (IDA & IBRD countries)SudanSurinameSwazilandSwedenSwitzerlandSyrian Arab RepublicTajikistanTanzaniaThailandTimor-LesteTogoTongaTrinidad and TobagoTunisiaTurkeyTurkmenistanUgandaUkraineUnited Arab EmiratesUnited KingdomUnited StatesUpper middle incomeUruguayUzbekistanVanuatuVenezuela, RBVietnamWest Bank and GazaWorldYemen, Rep.ZambiaZimbabwe Timeline:
This timeline shows a graph from 1961 to 2016 of East Asia & Pacific (excluding high income). No data until 1960. Number of actual observations by date: 56.
Source name:
World Development Indicators
Source organization:
World Bank national accounts data, and OECD National Accounts data files.
Categories, topics:
Economy & Growth, Trade
Last updated:
apr 23, 2017
Indicators value changes by year
Maximum:
40.931
jan 1, 2007
At the date of observation
Value
Absolute change
Change from previous value
jan 1, 1961
8.055
+8.055
0.0%
jan 1, 1962
7.209
-0.846
-10.5%
jan 1, 1963
6.92
-0.29
-4.02%
jan 1, 1964
6.991
+0.071
1.03%
jan 1, 1965
7.148
+0.157
2.25%
jan 1, 1966
6.345
-0.803
-11.24%
jan 1, 1967
6.94
+0.596
9.39%
jan 1, 1968
6.328
-0.612
-8.82%
jan 1, 1969
6.46
+0.132
2.09%
jan 1, 1970
6.095
-0.365
-5.66%
jan 1, 1971
6.154
+0.059
0.97%
jan 1, 1972
6.373
+0.219
3.55%
jan 1, 1973
6.895
+0.523
8.2%
jan 1, 1974
8.405
+1.51
21.9%
jan 1, 1975
10.11
+1.705
20.28%
jan 1, 1976
9.028
-1.082
-10.7%
jan 1, 1977
9.143
+0.114
1.27%
jan 1, 1978
9.006
-0.137
-1.5%
jan 1, 1979
8.976
-0.029
-0.33%
jan 1, 1980
10.575
+1.599
17.81%
jan 1, 1981
11.705
+1.13
10.69%
jan 1, 1982
12.308
+0.603
5.15%
jan 1, 1983
14.585
+2.277
18.5%
jan 1, 1984
13.47
-1.115
-7.64%
jan 1, 1985
13.537
+0.066
0.49%
jan 1, 1986
12.544
-0.993
-7.34%
jan 1, 1987
12.571
+0.028
0.22%
jan 1, 1988
16.5
+3.928
31.25%
jan 1, 1989
18.399
+1.899
11.51%
jan 1, 1990
17.155
-1.244
-6.76%
jan 1, 1991
18.78
+1.626
9.48%
jan 1, 1992
20.063
+1.283
6.83%
jan 1, 1993
20.911
+0.848
4.23%
jan 1, 1994
22.159
+1.248
5.97%
jan 1, 1995
23.739
+1.58
7.13%
jan 1, 1996
23.435
-0.304
-1.28%
jan 1, 1997
23.629
+0.194
0.83%
jan 1, 1998
24.498
+0.87
3.68%
jan 1, 1999
27.788
+3.29
13.43%
jan 1, 2000
26.505
-1.283
-4.62%
jan 1, 2001
29.29
+2.785
10.51%
jan 1, 2002
28.28
-1.01
-3.45%
jan 1, 2003
29.272
+0.993
3.51%
jan 1, 2004
32.874
+3.602
12.3%
jan 1, 2005
36.701
+3.827
11.64%
jan 1, 2006
39.026
+2.324
6.33%
jan 1, 2007
40.931
+1.906
4.88%
jan 1, 2008
39.574
-1.358
-3.32%
jan 1, 2009
36.205
-3.369
-8.51%
jan 1, 2010
28.873
-7.331
-20.25%
jan 1, 2011
30.559
+1.685
5.84%
jan 1, 2012
31.046
+0.487
1.59%
jan 1, 2013
29.874
-1.172
-3.78%
jan 1, 2014
28.94
-0.934
-3.13%
jan 1, 2015
28.678
-0.261
-0.9%
jan 1, 2016
26.835
-1.843
-6.43%
Ranking of countries by current statistics by years


Comments: