29
/
en
AIzaSyAYiBZKx7MnpbEhh9jyipgxe19OcubqV5w
April 1, 2024
174041
Lao PDR
LAO
true
2
1
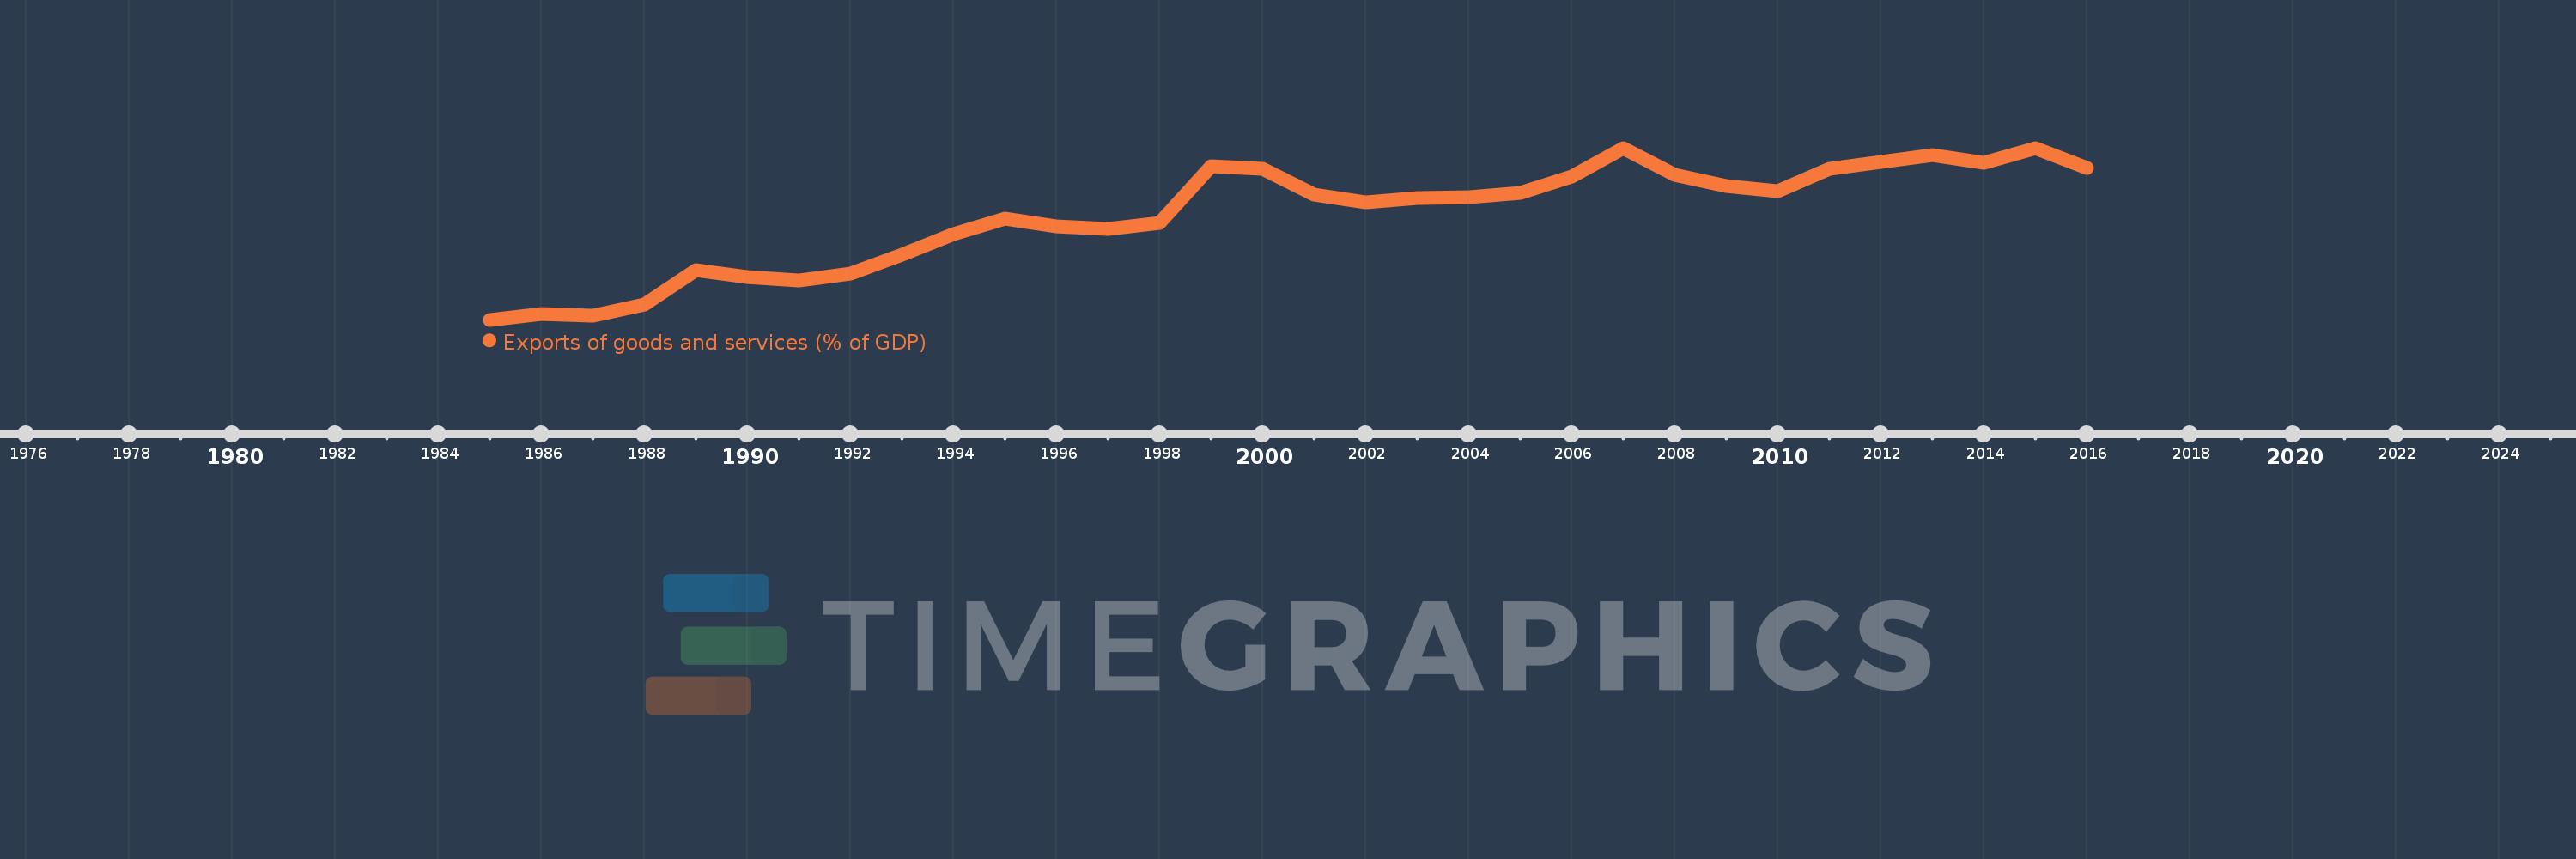
Exports of goods and services (% of GDP)
2016,2015,2014,2013,2012,2011,2010,2009,2008,2007,2006,2005,2004,2003,2002,2001,2000,1999,1998,1997,1996,1995,1994,1993,1992,1991,1990,1989,1988,1987,1986,1985
This statistics in other country:
AfghanistanAlbaniaAlgeriaAngolaAntigua and BarbudaArab WorldArgentinaArmeniaArubaAustraliaAustriaAzerbaijanBahamas, TheBahrainBangladeshBarbadosBelarusBelgiumBelizeBeninBermudaBhutanBoliviaBosnia and HerzegovinaBotswanaBrazilBrunei DarussalamBulgariaBurkina FasoBurundiCabo VerdeCambodiaCameroonCanadaCaribbean small statesCentral African RepublicCentral Europe and the BalticsChadChileChinaColombiaComorosCongo, Dem. Rep.Congo, Rep.Costa RicaCote d'IvoireCroatiaCubaCyprusCzech RepublicDenmarkDjiboutiDominicaDominican RepublicEarly-demographic dividendEast Asia & PacificEast Asia & Pacific (excluding high income)East Asia & Pacific (IDA & IBRD countries)EcuadorEgypt, Arab Rep.El SalvadorEquatorial GuineaEritreaEstoniaEthiopiaEuro areaEurope & Central AsiaEurope & Central Asia (excluding high income)Europe & Central Asia (IDA & IBRD countries)European UnionFaroe IslandsFijiFinlandFragile and conflict affected situationsFranceFrench PolynesiaGabonGambia, TheGeorgiaGermanyGhanaGreeceGrenadaGuatemalaGuineaGuinea-BissauGuyanaHaitiHeavily indebted poor countries (HIPC)High incomeHondurasHong Kong SAR, ChinaHungaryIBRD onlyIcelandIDA & IBRD totalIDA blendIDA onlyIDA totalIndiaIndonesiaIran, Islamic Rep.IraqIrelandIsraelItalyJamaicaJapanJordanKazakhstanKenyaKiribatiKorea, Rep.KosovoKuwaitKyrgyz RepublicLao PDRLate-demographic dividendLatin America & Caribbean Latin America & Caribbean (excluding high income)Latin America & the Caribbean (IDA & IBRD countries)LatviaLeast developed countries: UN classificationLebanonLesothoLiberiaLibyaLithuaniaLow & middle incomeLow incomeLower middle incomeLuxembourgMacao SAR, ChinaMacedonia, FYRMadagascarMalawiMalaysiaMaldivesMaliMaltaMauritaniaMauritiusMexicoMicronesia, Fed. Sts.Middle East & North AfricaMiddle East & North Africa (excluding high income)Middle East & North Africa (IDA & IBRD countries)Middle incomeMoldovaMongoliaMontenegroMoroccoMozambiqueMyanmarNamibiaNepalNetherlandsNew CaledoniaNew ZealandNicaraguaNigerNigeriaNorth AmericaNorwayOECD membersOmanOther small statesPacific island small statesPakistanPalauPanamaPapua New GuineaParaguayPeruPhilippinesPolandPortugalPost-demographic dividendPre-demographic dividendPuerto RicoQatarRomaniaRussian FederationRwandaSamoaSaudi ArabiaSenegalSerbiaSeychellesSierra LeoneSingaporeSlovak RepublicSloveniaSmall statesSolomon IslandsSomaliaSouth AfricaSouth AsiaSouth Asia (IDA & IBRD)South SudanSpainSri LankaSt. Kitts and NevisSt. LuciaSt. Vincent and the GrenadinesSub-Saharan Africa Sub-Saharan Africa (excluding high income)Sub-Saharan Africa (IDA & IBRD countries)SudanSurinameSwazilandSwedenSwitzerlandSyrian Arab RepublicTajikistanTanzaniaThailandTimor-LesteTogoTongaTrinidad and TobagoTunisiaTurkeyTurkmenistanUgandaUkraineUnited Arab EmiratesUnited KingdomUnited StatesUpper middle incomeUruguayUzbekistanVanuatuVenezuela, RBVietnamWest Bank and GazaWorldYemen, Rep.ZambiaZimbabwe Timeline:
This timeline shows a graph from 1985 to 2016 of Lao PDR. No data until 1984. Number of actual observations by date: 32.
Source name:
World Development Indicators
Source organization:
World Bank national accounts data, and OECD National Accounts data files.
Categories, topics:
Economy & Growth, Trade
Last updated:
apr 23, 2017
Indicators value changes by year
Maximum:
40.398
jan 1, 2007
At the date of observation
Value
Absolute change
Change from previous value
jan 1, 1985
2.764
+2.764
0.0%
jan 1, 1986
4.038
+1.273
46.06%
jan 1, 1987
3.614
-0.424
-10.5%
jan 1, 1988
6.092
+2.479
68.59%
jan 1, 1989
13.629
+7.536
123.7%
jan 1, 1990
12.131
-1.498
-10.99%
jan 1, 1991
11.329
-0.802
-6.61%
jan 1, 1992
12.954
+1.625
14.34%
jan 1, 1993
17.026
+4.072
31.44%
jan 1, 1994
21.462
+4.436
26.05%
jan 1, 1995
24.987
+3.525
16.43%
jan 1, 1996
23.22
-1.767
-7.07%
jan 1, 1997
22.699
-0.522
-2.25%
jan 1, 1998
23.892
+1.193
5.26%
jan 1, 1999
36.456
+12.564
52.58%
jan 1, 2000
35.876
-0.58
-1.59%
jan 1, 2001
30.096
-5.78
-16.11%
jan 1, 2002
28.488
-1.607
-5.34%
jan 1, 2003
29.385
+0.896
3.15%
jan 1, 2004
29.686
+0.301
1.02%
jan 1, 2005
30.553
+0.867
2.92%
jan 1, 2006
34.158
+3.605
11.8%
jan 1, 2007
40.398
+6.241
18.27%
jan 1, 2008
34.499
-5.899
-14.6%
jan 1, 2009
32.016
-2.483
-7.2%
jan 1, 2010
30.882
-1.135
-3.54%
jan 1, 2011
35.81
+4.929
15.96%
jan 1, 2012
37.411
+1.601
4.47%
jan 1, 2013
38.853
+1.442
3.85%
jan 1, 2014
37.112
-1.742
-4.48%
jan 1, 2015
40.373
+3.262
8.79%
jan 1, 2016
36.009
-4.364
-10.81%
Ranking of countries by current statistics by years


Comments: