29
/
en
AIzaSyAYiBZKx7MnpbEhh9jyipgxe19OcubqV5w
April 1, 2024
48943
Middle East & North Africa (excluding high income)
MNA
false
2
1
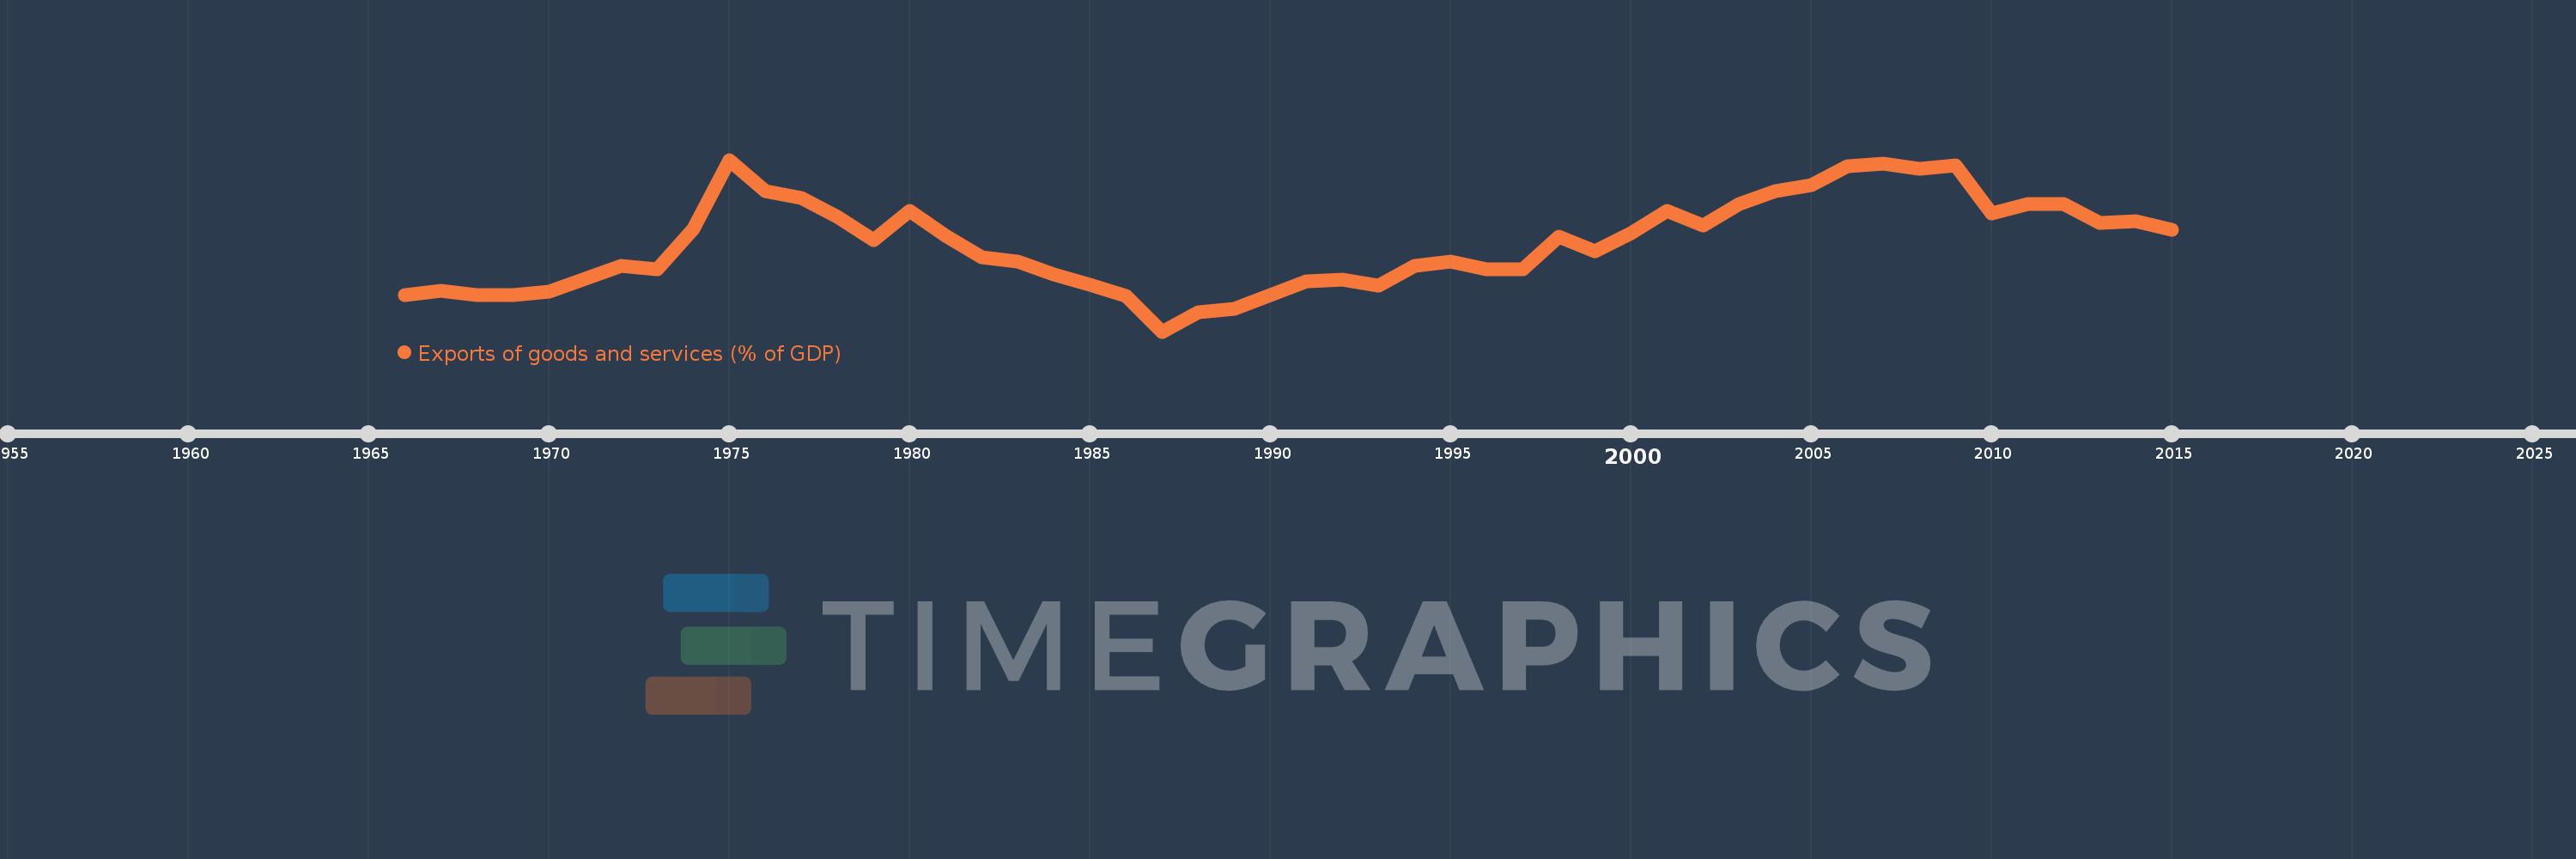
Exports of goods and services (% of GDP)
2015,2014,2013,2012,2011,2010,2009,2008,2007,2006,2005,2004,2003,2002,2001,2000,1999,1998,1997,1996,1995,1994,1993,1992,1991,1990,1989,1988,1987,1986,1985,1984,1983,1982,1981,1980,1979,1978,1977,1976,1975,1974,1973,1972,1971,1970,1969,1968,1967,1966
This statistics in other country:
AfghanistanAlbaniaAlgeriaAngolaAntigua and BarbudaArab WorldArgentinaArmeniaArubaAustraliaAustriaAzerbaijanBahamas, TheBahrainBangladeshBarbadosBelarusBelgiumBelizeBeninBermudaBhutanBoliviaBosnia and HerzegovinaBotswanaBrazilBrunei DarussalamBulgariaBurkina FasoBurundiCabo VerdeCambodiaCameroonCanadaCaribbean small statesCentral African RepublicCentral Europe and the BalticsChadChileChinaColombiaComorosCongo, Dem. Rep.Congo, Rep.Costa RicaCote d'IvoireCroatiaCubaCyprusCzech RepublicDenmarkDjiboutiDominicaDominican RepublicEarly-demographic dividendEast Asia & PacificEast Asia & Pacific (excluding high income)East Asia & Pacific (IDA & IBRD countries)EcuadorEgypt, Arab Rep.El SalvadorEquatorial GuineaEritreaEstoniaEthiopiaEuro areaEurope & Central AsiaEurope & Central Asia (excluding high income)Europe & Central Asia (IDA & IBRD countries)European UnionFaroe IslandsFijiFinlandFragile and conflict affected situationsFranceFrench PolynesiaGabonGambia, TheGeorgiaGermanyGhanaGreeceGrenadaGuatemalaGuineaGuinea-BissauGuyanaHaitiHeavily indebted poor countries (HIPC)High incomeHondurasHong Kong SAR, ChinaHungaryIBRD onlyIcelandIDA & IBRD totalIDA blendIDA onlyIDA totalIndiaIndonesiaIran, Islamic Rep.IraqIrelandIsraelItalyJamaicaJapanJordanKazakhstanKenyaKiribatiKorea, Rep.KosovoKuwaitKyrgyz RepublicLao PDRLate-demographic dividendLatin America & Caribbean Latin America & Caribbean (excluding high income)Latin America & the Caribbean (IDA & IBRD countries)LatviaLeast developed countries: UN classificationLebanonLesothoLiberiaLibyaLithuaniaLow & middle incomeLow incomeLower middle incomeLuxembourgMacao SAR, ChinaMacedonia, FYRMadagascarMalawiMalaysiaMaldivesMaliMaltaMauritaniaMauritiusMexicoMicronesia, Fed. Sts.Middle East & North AfricaMiddle East & North Africa (excluding high income)Middle East & North Africa (IDA & IBRD countries)Middle incomeMoldovaMongoliaMontenegroMoroccoMozambiqueMyanmarNamibiaNepalNetherlandsNew CaledoniaNew ZealandNicaraguaNigerNigeriaNorth AmericaNorwayOECD membersOmanOther small statesPacific island small statesPakistanPalauPanamaPapua New GuineaParaguayPeruPhilippinesPolandPortugalPost-demographic dividendPre-demographic dividendPuerto RicoQatarRomaniaRussian FederationRwandaSamoaSaudi ArabiaSenegalSerbiaSeychellesSierra LeoneSingaporeSlovak RepublicSloveniaSmall statesSolomon IslandsSomaliaSouth AfricaSouth AsiaSouth Asia (IDA & IBRD)South SudanSpainSri LankaSt. Kitts and NevisSt. LuciaSt. Vincent and the GrenadinesSub-Saharan Africa Sub-Saharan Africa (excluding high income)Sub-Saharan Africa (IDA & IBRD countries)SudanSurinameSwazilandSwedenSwitzerlandSyrian Arab RepublicTajikistanTanzaniaThailandTimor-LesteTogoTongaTrinidad and TobagoTunisiaTurkeyTurkmenistanUgandaUkraineUnited Arab EmiratesUnited KingdomUnited StatesUpper middle incomeUruguayUzbekistanVanuatuVenezuela, RBVietnamWest Bank and GazaWorldYemen, Rep.ZambiaZimbabwe Timeline:
This timeline shows a graph from 1966 to 2015 of Middle East & North Africa (excluding high income). No data until 1965. Number of actual observations by date: 50.
Source name:
World Development Indicators
Source organization:
World Bank national accounts data, and OECD National Accounts data files.
Categories, topics:
Economy & Growth, Trade
Last updated:
apr 23, 2017
Indicators value changes by year
Minimum:
11.915
jan 1, 1987
Maximum:
39.886
jan 1, 1975
At the date of observation
Value
Absolute change
Change from previous value
jan 1, 1966
17.832
+17.832
0.0%
jan 1, 1967
18.524
+0.693
3.88%
jan 1, 1968
17.907
-0.617
-3.33%
jan 1, 1969
17.79
-0.117
-0.65%
jan 1, 1970
18.368
+0.578
3.25%
jan 1, 1971
20.536
+2.168
11.8%
jan 1, 1972
22.552
+2.016
9.81%
jan 1, 1973
22.116
-0.436
-1.93%
jan 1, 1974
28.613
+6.497
29.38%
jan 1, 1975
39.886
+11.273
39.4%
jan 1, 1976
34.729
-5.157
-12.93%
jan 1, 1977
33.634
-1.094
-3.15%
jan 1, 1978
30.607
-3.027
-9.0%
jan 1, 1979
26.869
-3.737
-12.21%
jan 1, 1980
31.531
+4.661
17.35%
jan 1, 1981
27.535
-3.996
-12.67%
jan 1, 1982
24.045
-3.49
-12.67%
jan 1, 1983
23.258
-0.787
-3.27%
jan 1, 1984
21.256
-2.002
-8.61%
jan 1, 1985
19.512
-1.744
-8.21%
jan 1, 1986
17.773
-1.738
-8.91%
jan 1, 1987
11.915
-5.858
-32.96%
jan 1, 1988
14.999
+3.084
25.88%
jan 1, 1989
15.595
+0.596
3.97%
jan 1, 1990
17.918
+2.323
14.9%
jan 1, 1991
20.046
+2.128
11.88%
jan 1, 1992
20.439
+0.393
1.96%
jan 1, 1993
19.4
-1.039
-5.08%
jan 1, 1994
22.675
+3.275
16.88%
jan 1, 1995
23.321
+0.646
2.85%
jan 1, 1996
22.07
-1.25
-5.36%
jan 1, 1997
22.019
-0.051
-0.23%
jan 1, 1998
27.405
+5.386
24.46%
jan 1, 1999
24.993
-2.412
-8.8%
jan 1, 2000
27.956
+2.963
11.85%
jan 1, 2001
31.535
+3.579
12.8%
jan 1, 2002
29.166
-2.369
-7.51%
jan 1, 2003
32.725
+3.558
12.2%
jan 1, 2004
34.751
+2.026
6.19%
jan 1, 2005
35.692
+0.941
2.71%
jan 1, 2006
38.885
+3.194
8.95%
jan 1, 2007
39.207
+0.322
0.83%
jan 1, 2008
38.351
-0.856
-2.18%
jan 1, 2009
38.943
+0.592
1.54%
jan 1, 2010
31.107
-7.836
-20.12%
jan 1, 2011
32.616
+1.509
4.85%
jan 1, 2012
32.671
+0.055
0.17%
jan 1, 2013
29.544
-3.127
-9.57%
jan 1, 2014
29.924
+0.381
1.29%
jan 1, 2015
28.457
-1.467
-4.9%
Ranking of countries by current statistics by years


Comments: