29
/
en
AIzaSyAYiBZKx7MnpbEhh9jyipgxe19OcubqV5w
April 1, 2024
54734
Post-demographic dividend
PST
false
2
1
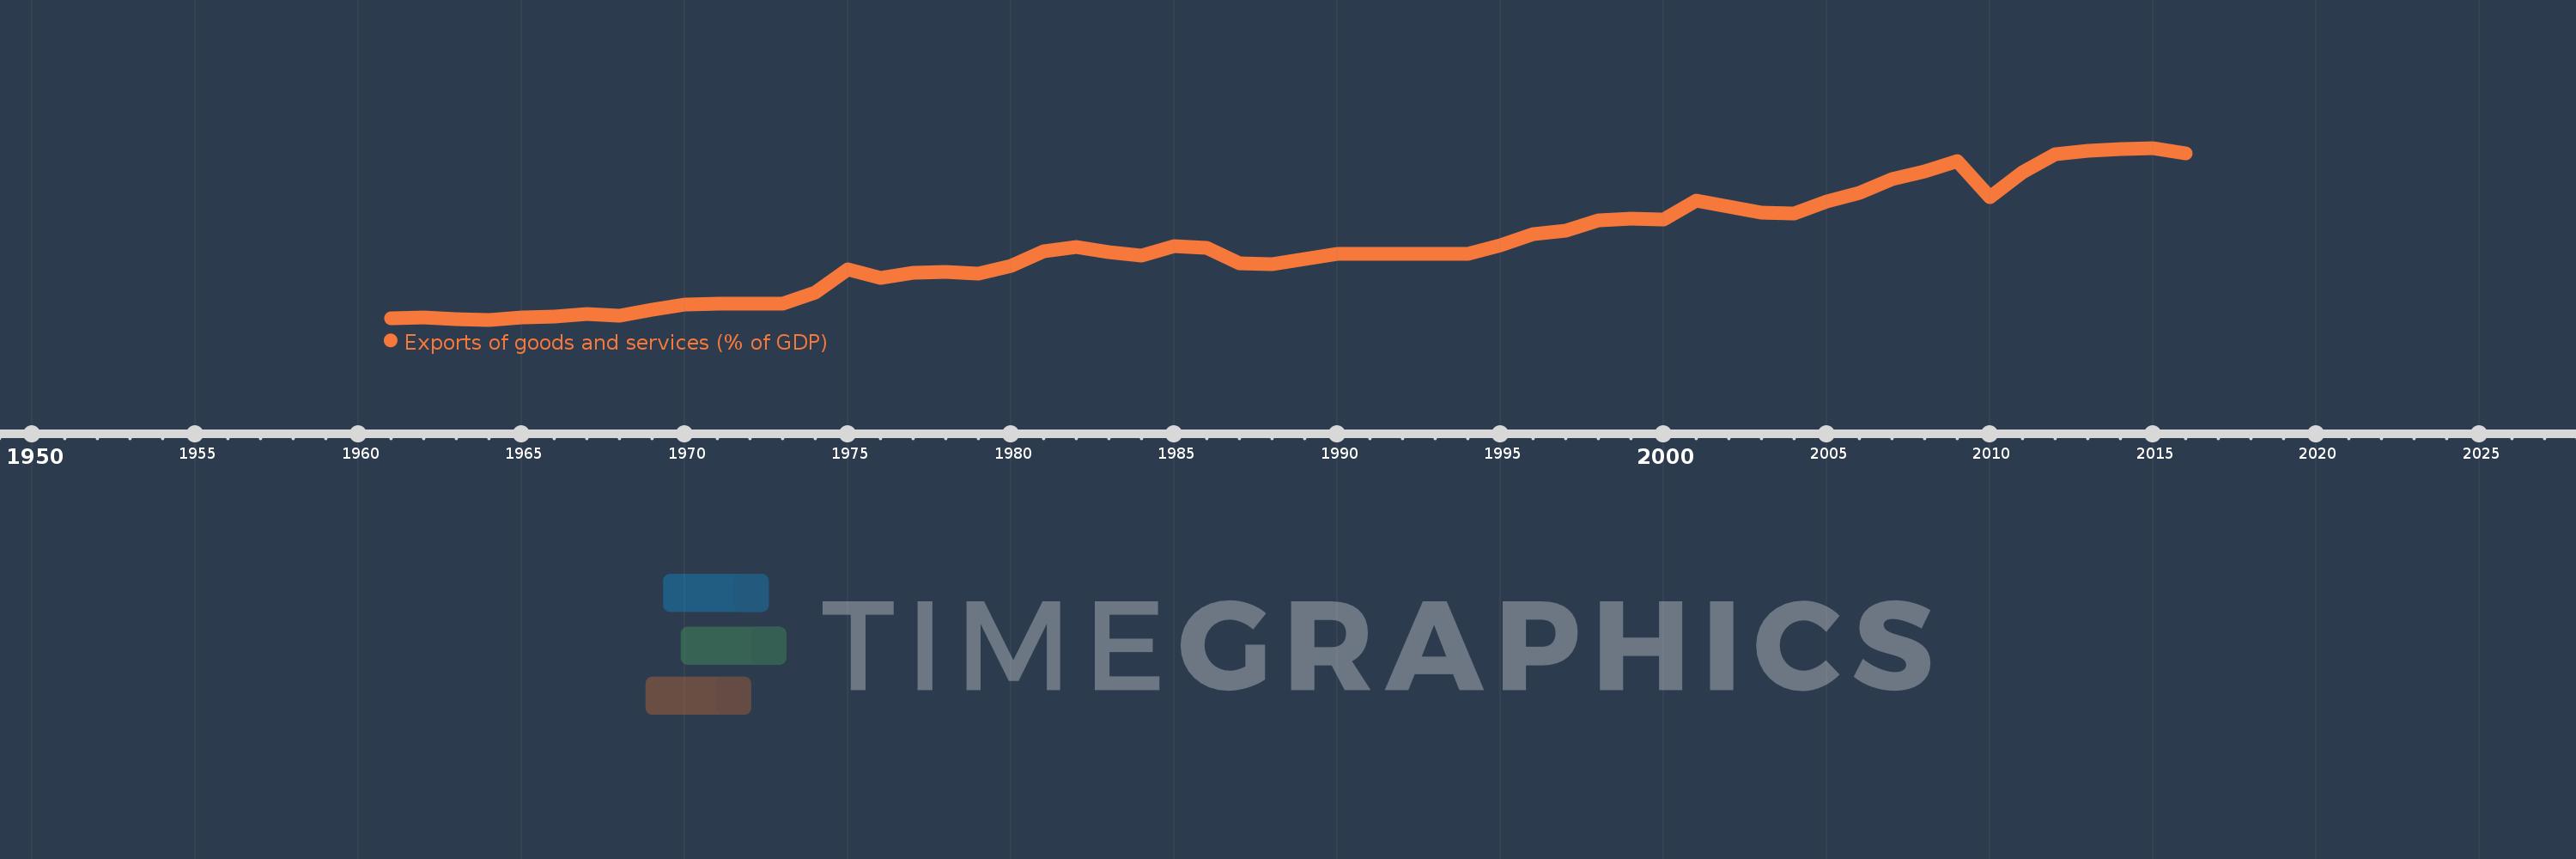
Exports of goods and services (% of GDP)
2016,2015,2014,2013,2012,2011,2010,2009,2008,2007,2006,2005,2004,2003,2002,2001,2000,1999,1998,1997,1996,1995,1994,1993,1992,1991,1990,1989,1988,1987,1986,1985,1984,1983,1982,1981,1980,1979,1978,1977,1976,1975,1974,1973,1972,1971,1970,1969,1968,1967,1966,1965,1964,1963,1962,1961
This statistics in other country:
AfghanistanAlbaniaAlgeriaAngolaAntigua and BarbudaArab WorldArgentinaArmeniaArubaAustraliaAustriaAzerbaijanBahamas, TheBahrainBangladeshBarbadosBelarusBelgiumBelizeBeninBermudaBhutanBoliviaBosnia and HerzegovinaBotswanaBrazilBrunei DarussalamBulgariaBurkina FasoBurundiCabo VerdeCambodiaCameroonCanadaCaribbean small statesCentral African RepublicCentral Europe and the BalticsChadChileChinaColombiaComorosCongo, Dem. Rep.Congo, Rep.Costa RicaCote d'IvoireCroatiaCubaCyprusCzech RepublicDenmarkDjiboutiDominicaDominican RepublicEarly-demographic dividendEast Asia & PacificEast Asia & Pacific (excluding high income)East Asia & Pacific (IDA & IBRD countries)EcuadorEgypt, Arab Rep.El SalvadorEquatorial GuineaEritreaEstoniaEthiopiaEuro areaEurope & Central AsiaEurope & Central Asia (excluding high income)Europe & Central Asia (IDA & IBRD countries)European UnionFaroe IslandsFijiFinlandFragile and conflict affected situationsFranceFrench PolynesiaGabonGambia, TheGeorgiaGermanyGhanaGreeceGrenadaGuatemalaGuineaGuinea-BissauGuyanaHaitiHeavily indebted poor countries (HIPC)High incomeHondurasHong Kong SAR, ChinaHungaryIBRD onlyIcelandIDA & IBRD totalIDA blendIDA onlyIDA totalIndiaIndonesiaIran, Islamic Rep.IraqIrelandIsraelItalyJamaicaJapanJordanKazakhstanKenyaKiribatiKorea, Rep.KosovoKuwaitKyrgyz RepublicLao PDRLate-demographic dividendLatin America & Caribbean Latin America & Caribbean (excluding high income)Latin America & the Caribbean (IDA & IBRD countries)LatviaLeast developed countries: UN classificationLebanonLesothoLiberiaLibyaLithuaniaLow & middle incomeLow incomeLower middle incomeLuxembourgMacao SAR, ChinaMacedonia, FYRMadagascarMalawiMalaysiaMaldivesMaliMaltaMauritaniaMauritiusMexicoMicronesia, Fed. Sts.Middle East & North AfricaMiddle East & North Africa (excluding high income)Middle East & North Africa (IDA & IBRD countries)Middle incomeMoldovaMongoliaMontenegroMoroccoMozambiqueMyanmarNamibiaNepalNetherlandsNew CaledoniaNew ZealandNicaraguaNigerNigeriaNorth AmericaNorwayOECD membersOmanOther small statesPacific island small statesPakistanPalauPanamaPapua New GuineaParaguayPeruPhilippinesPolandPortugalPost-demographic dividendPre-demographic dividendPuerto RicoQatarRomaniaRussian FederationRwandaSamoaSaudi ArabiaSenegalSerbiaSeychellesSierra LeoneSingaporeSlovak RepublicSloveniaSmall statesSolomon IslandsSomaliaSouth AfricaSouth AsiaSouth Asia (IDA & IBRD)South SudanSpainSri LankaSt. Kitts and NevisSt. LuciaSt. Vincent and the GrenadinesSub-Saharan Africa Sub-Saharan Africa (excluding high income)Sub-Saharan Africa (IDA & IBRD countries)SudanSurinameSwazilandSwedenSwitzerlandSyrian Arab RepublicTajikistanTanzaniaThailandTimor-LesteTogoTongaTrinidad and TobagoTunisiaTurkeyTurkmenistanUgandaUkraineUnited Arab EmiratesUnited KingdomUnited StatesUpper middle incomeUruguayUzbekistanVanuatuVenezuela, RBVietnamWest Bank and GazaWorldYemen, Rep.ZambiaZimbabwe Timeline:
This timeline shows a graph from 1961 to 2016 of Post-demographic dividend. No data until 1960. Number of actual observations by date: 56.
Source name:
World Development Indicators
Source organization:
World Bank national accounts data, and OECD National Accounts data files.
Categories, topics:
Economy & Growth, Trade
Last updated:
apr 23, 2017
Indicators value changes by year
Minimum:
12.572
jan 1, 1964
Maximum:
30.063
jan 1, 2015
At the date of observation
Value
Absolute change
Change from previous value
jan 1, 1961
12.76
+12.76
0.0%
jan 1, 1962
12.835
+0.076
0.59%
jan 1, 1963
12.672
-0.163
-1.27%
jan 1, 1964
12.572
-0.1
-0.79%
jan 1, 1965
12.8
+0.227
1.81%
jan 1, 1966
12.935
+0.135
1.06%
jan 1, 1967
13.149
+0.214
1.65%
jan 1, 1968
12.961
-0.188
-1.43%
jan 1, 1969
13.591
+0.63
4.86%
jan 1, 1970
14.079
+0.487
3.58%
jan 1, 1971
14.208
+0.129
0.92%
jan 1, 1972
14.238
+0.03
0.21%
jan 1, 1973
14.173
-0.064
-0.45%
jan 1, 1974
15.318
+1.145
8.08%
jan 1, 1975
17.664
+2.346
15.31%
jan 1, 1976
16.806
-0.858
-4.86%
jan 1, 1977
17.362
+0.555
3.3%
jan 1, 1978
17.456
+0.094
0.54%
jan 1, 1979
17.232
-0.224
-1.28%
jan 1, 1980
18.092
+0.86
4.99%
jan 1, 1981
19.51
+1.418
7.84%
jan 1, 1982
20.01
+0.5
2.56%
jan 1, 1983
19.455
-0.555
-2.78%
jan 1, 1984
19.148
-0.306
-1.57%
jan 1, 1985
20.06
+0.911
4.76%
jan 1, 1986
19.878
-0.182
-0.91%
jan 1, 1987
18.299
-1.578
-7.94%
jan 1, 1988
18.249
-0.05
-0.27%
jan 1, 1989
18.727
+0.477
2.62%
jan 1, 1990
19.251
+0.524
2.8%
jan 1, 1991
19.291
+0.04
0.21%
jan 1, 1992
19.279
-0.012
-0.06%
jan 1, 1993
19.239
-0.04
-0.21%
jan 1, 1994
19.318
+0.079
0.41%
jan 1, 1995
20.138
+0.819
4.24%
jan 1, 1996
21.328
+1.19
5.91%
jan 1, 1997
21.61
+0.282
1.32%
jan 1, 1998
22.714
+1.104
5.11%
jan 1, 1999
22.868
+0.155
0.68%
jan 1, 2000
22.791
-0.077
-0.34%
jan 1, 2001
24.72
+1.929
8.46%
jan 1, 2002
24.094
-0.626
-2.53%
jan 1, 2003
23.512
-0.582
-2.41%
jan 1, 2004
23.353
-0.159
-0.68%
jan 1, 2005
24.623
+1.27
5.44%
jan 1, 2006
25.527
+0.904
3.67%
jan 1, 2007
26.91
+1.383
5.42%
jan 1, 2008
27.646
+0.736
2.74%
jan 1, 2009
28.692
+1.046
3.78%
jan 1, 2010
25.086
-3.606
-12.57%
jan 1, 2011
27.602
+2.516
10.03%
jan 1, 2012
29.443
+1.841
6.67%
jan 1, 2013
29.773
+0.33
1.12%
jan 1, 2014
29.939
+0.166
0.56%
jan 1, 2015
30.063
+0.124
0.41%
jan 1, 2016
29.533
-0.53
-1.76%
Ranking of countries by current statistics by years


Comments: