29
/
en
AIzaSyAYiBZKx7MnpbEhh9jyipgxe19OcubqV5w
April 1, 2024
239219
Sierra Leone
SLE
true
2
1
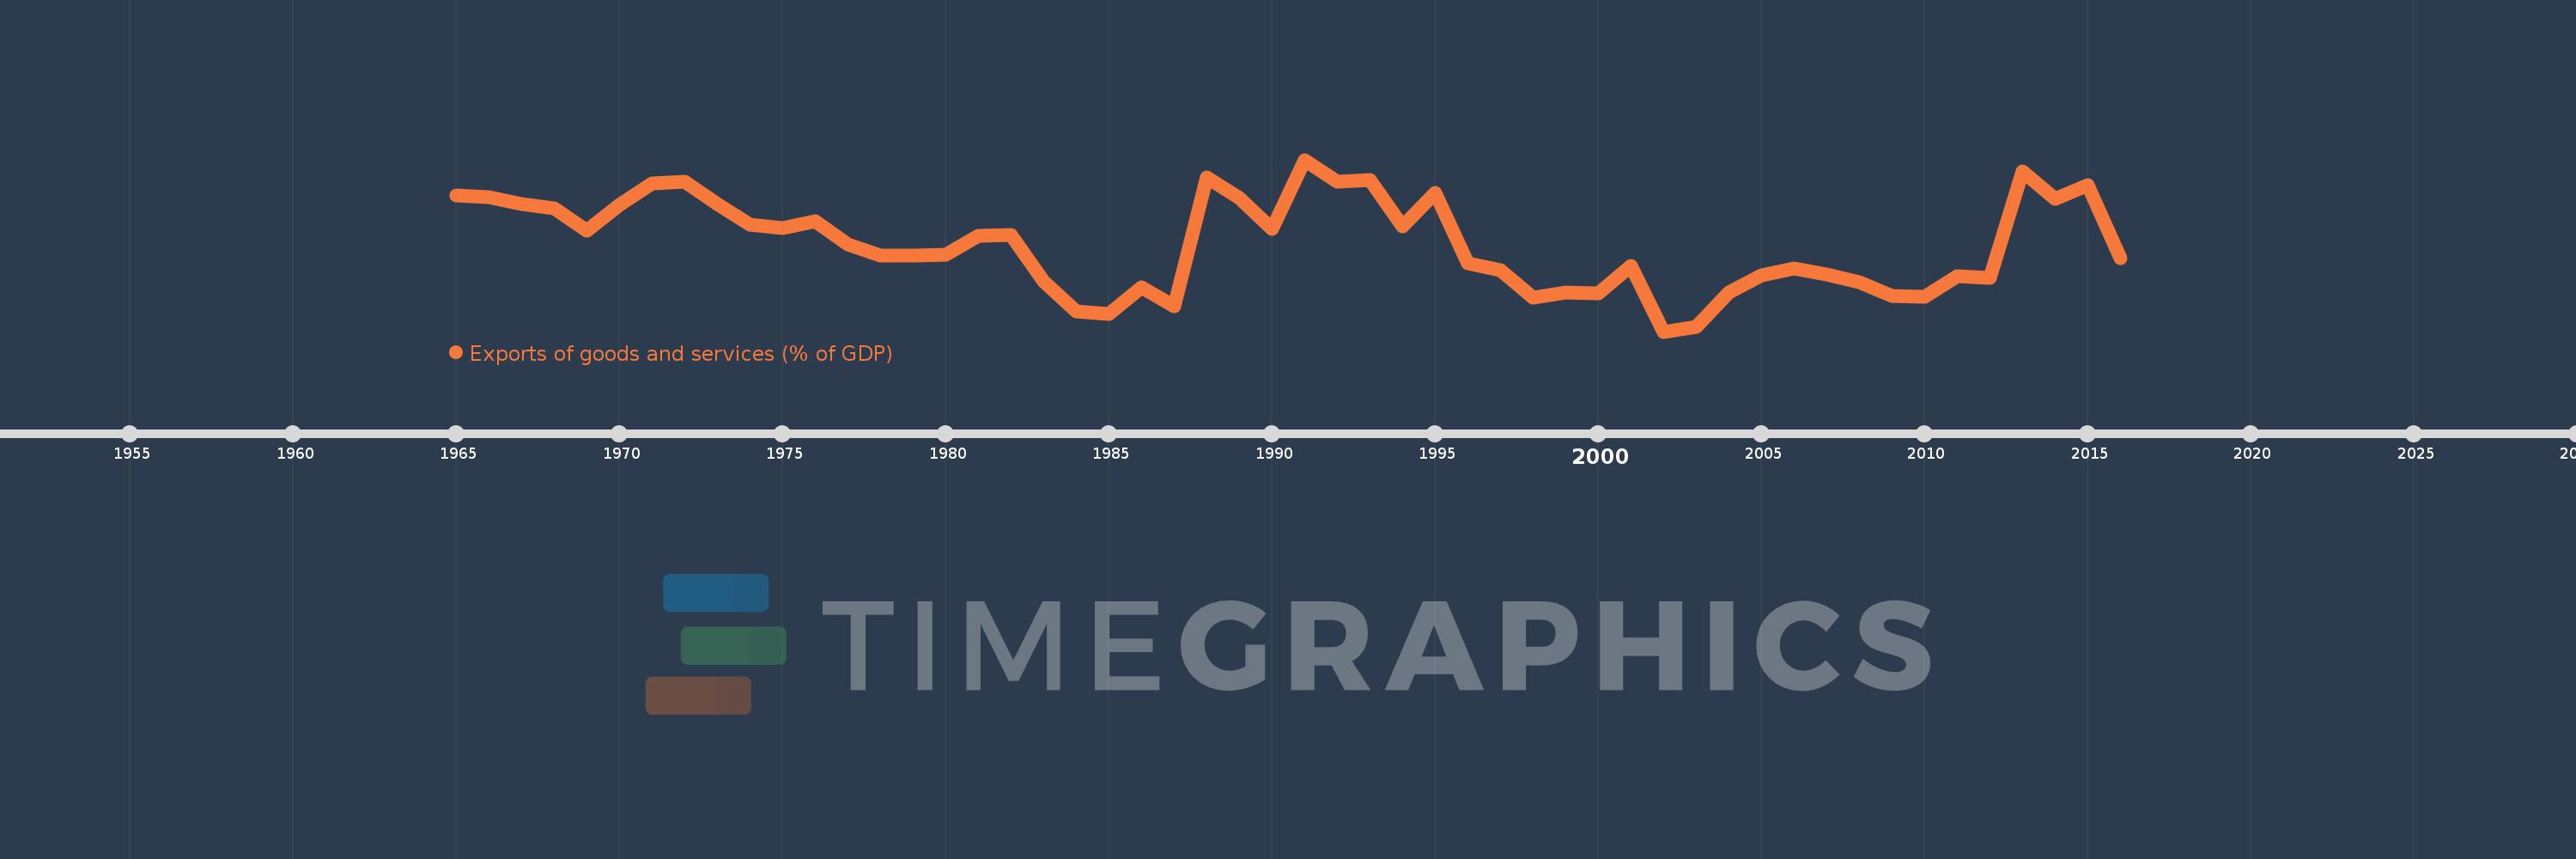
Exports of goods and services (% of GDP)
2016,2015,2014,2013,2012,2011,2010,2009,2008,2007,2006,2005,2004,2003,2002,2001,2000,1999,1998,1997,1996,1995,1994,1993,1992,1991,1990,1989,1988,1987,1986,1985,1984,1983,1982,1981,1980,1979,1978,1977,1976,1975,1974,1973,1972,1971,1970,1969,1968,1967,1966,1965
This statistics in other country:
AfghanistanAlbaniaAlgeriaAngolaAntigua and BarbudaArab WorldArgentinaArmeniaArubaAustraliaAustriaAzerbaijanBahamas, TheBahrainBangladeshBarbadosBelarusBelgiumBelizeBeninBermudaBhutanBoliviaBosnia and HerzegovinaBotswanaBrazilBrunei DarussalamBulgariaBurkina FasoBurundiCabo VerdeCambodiaCameroonCanadaCaribbean small statesCentral African RepublicCentral Europe and the BalticsChadChileChinaColombiaComorosCongo, Dem. Rep.Congo, Rep.Costa RicaCote d'IvoireCroatiaCubaCyprusCzech RepublicDenmarkDjiboutiDominicaDominican RepublicEarly-demographic dividendEast Asia & PacificEast Asia & Pacific (excluding high income)East Asia & Pacific (IDA & IBRD countries)EcuadorEgypt, Arab Rep.El SalvadorEquatorial GuineaEritreaEstoniaEthiopiaEuro areaEurope & Central AsiaEurope & Central Asia (excluding high income)Europe & Central Asia (IDA & IBRD countries)European UnionFaroe IslandsFijiFinlandFragile and conflict affected situationsFranceFrench PolynesiaGabonGambia, TheGeorgiaGermanyGhanaGreeceGrenadaGuatemalaGuineaGuinea-BissauGuyanaHaitiHeavily indebted poor countries (HIPC)High incomeHondurasHong Kong SAR, ChinaHungaryIBRD onlyIcelandIDA & IBRD totalIDA blendIDA onlyIDA totalIndiaIndonesiaIran, Islamic Rep.IraqIrelandIsraelItalyJamaicaJapanJordanKazakhstanKenyaKiribatiKorea, Rep.KosovoKuwaitKyrgyz RepublicLao PDRLate-demographic dividendLatin America & Caribbean Latin America & Caribbean (excluding high income)Latin America & the Caribbean (IDA & IBRD countries)LatviaLeast developed countries: UN classificationLebanonLesothoLiberiaLibyaLithuaniaLow & middle incomeLow incomeLower middle incomeLuxembourgMacao SAR, ChinaMacedonia, FYRMadagascarMalawiMalaysiaMaldivesMaliMaltaMauritaniaMauritiusMexicoMicronesia, Fed. Sts.Middle East & North AfricaMiddle East & North Africa (excluding high income)Middle East & North Africa (IDA & IBRD countries)Middle incomeMoldovaMongoliaMontenegroMoroccoMozambiqueMyanmarNamibiaNepalNetherlandsNew CaledoniaNew ZealandNicaraguaNigerNigeriaNorth AmericaNorwayOECD membersOmanOther small statesPacific island small statesPakistanPalauPanamaPapua New GuineaParaguayPeruPhilippinesPolandPortugalPost-demographic dividendPre-demographic dividendPuerto RicoQatarRomaniaRussian FederationRwandaSamoaSaudi ArabiaSenegalSerbiaSeychellesSierra LeoneSingaporeSlovak RepublicSloveniaSmall statesSolomon IslandsSomaliaSouth AfricaSouth AsiaSouth Asia (IDA & IBRD)South SudanSpainSri LankaSt. Kitts and NevisSt. LuciaSt. Vincent and the GrenadinesSub-Saharan Africa Sub-Saharan Africa (excluding high income)Sub-Saharan Africa (IDA & IBRD countries)SudanSurinameSwazilandSwedenSwitzerlandSyrian Arab RepublicTajikistanTanzaniaThailandTimor-LesteTogoTongaTrinidad and TobagoTunisiaTurkeyTurkmenistanUgandaUkraineUnited Arab EmiratesUnited KingdomUnited StatesUpper middle incomeUruguayUzbekistanVanuatuVenezuela, RBVietnamWest Bank and GazaWorldYemen, Rep.ZambiaZimbabwe Timeline:
This timeline shows a graph from 1965 to 2016 of Sierra Leone. No data until 1964. Number of actual observations by date: 52.
Source name:
World Development Indicators
Source organization:
World Bank national accounts data, and OECD National Accounts data files.
Categories, topics:
Economy & Growth, Trade
Last updated:
apr 23, 2017
Indicators value changes by year
At the date of observation
Value
Absolute change
Change from previous value
jan 1, 1965
29.077
+29.077
0.0%
jan 1, 1966
28.866
-0.211
-0.72%
jan 1, 1967
27.778
-1.089
-3.77%
jan 1, 1968
27.078
-0.699
-2.52%
jan 1, 1969
23.683
-3.396
-12.54%
jan 1, 1970
27.63
+3.947
16.67%
jan 1, 1971
31.021
+3.392
12.28%
jan 1, 1972
31.268
+0.246
0.79%
jan 1, 1973
27.773
-3.495
-11.18%
jan 1, 1974
24.639
-3.134
-11.28%
jan 1, 1975
24.097
-0.542
-2.2%
jan 1, 1976
25.109
+1.012
4.2%
jan 1, 1977
21.54
-3.568
-14.21%
jan 1, 1978
19.72
-1.821
-8.45%
jan 1, 1979
19.823
+0.103
0.52%
jan 1, 1980
19.905
+0.082
0.42%
jan 1, 1981
22.865
+2.96
14.87%
jan 1, 1982
23.015
+0.15
0.66%
jan 1, 1983
15.756
-7.259
-31.54%
jan 1, 1984
11.071
-4.685
-29.73%
jan 1, 1985
10.625
-0.446
-4.03%
jan 1, 1986
14.822
+4.198
39.51%
jan 1, 1987
11.917
-2.906
-19.6%
jan 1, 1988
31.964
+20.047
168.23%
jan 1, 1989
28.725
-3.24
-10.13%
jan 1, 1990
23.918
-4.807
-16.73%
jan 1, 1991
34.69
+10.772
45.04%
jan 1, 1992
31.249
-3.441
-9.92%
jan 1, 1993
31.591
+0.342
1.09%
jan 1, 1994
24.283
-7.308
-23.13%
jan 1, 1995
29.512
+5.229
21.53%
jan 1, 1996
18.588
-10.923
-37.01%
jan 1, 1997
17.445
-1.143
-6.15%
jan 1, 1998
13.2
-4.246
-24.34%
jan 1, 1999
14.062
+0.862
6.53%
jan 1, 2000
13.828
-0.234
-1.66%
jan 1, 2001
18.135
+4.307
31.15%
jan 1, 2002
7.92
-10.215
-56.33%
jan 1, 2003
8.648
+0.729
9.2%
jan 1, 2004
14.067
+5.419
62.66%
jan 1, 2005
16.67
+2.603
18.5%
jan 1, 2006
17.817
+1.147
6.88%
jan 1, 2007
16.865
-0.952
-5.34%
jan 1, 2008
15.604
-1.262
-7.48%
jan 1, 2009
13.519
-2.084
-13.36%
jan 1, 2010
13.304
-0.215
-1.59%
jan 1, 2011
16.547
+3.243
24.38%
jan 1, 2012
16.267
-0.281
-1.7%
jan 1, 2013
32.905
+16.639
102.29%
jan 1, 2014
28.627
-4.279
-13.0%
jan 1, 2015
30.76
+2.133
7.45%
jan 1, 2016
19.363
-11.397
-37.05%
Ranking of countries by current statistics by years


Comments: