29
/
en
AIzaSyAYiBZKx7MnpbEhh9jyipgxe19OcubqV5w
April 1, 2024
84789
Benin
BEN
true
2
1
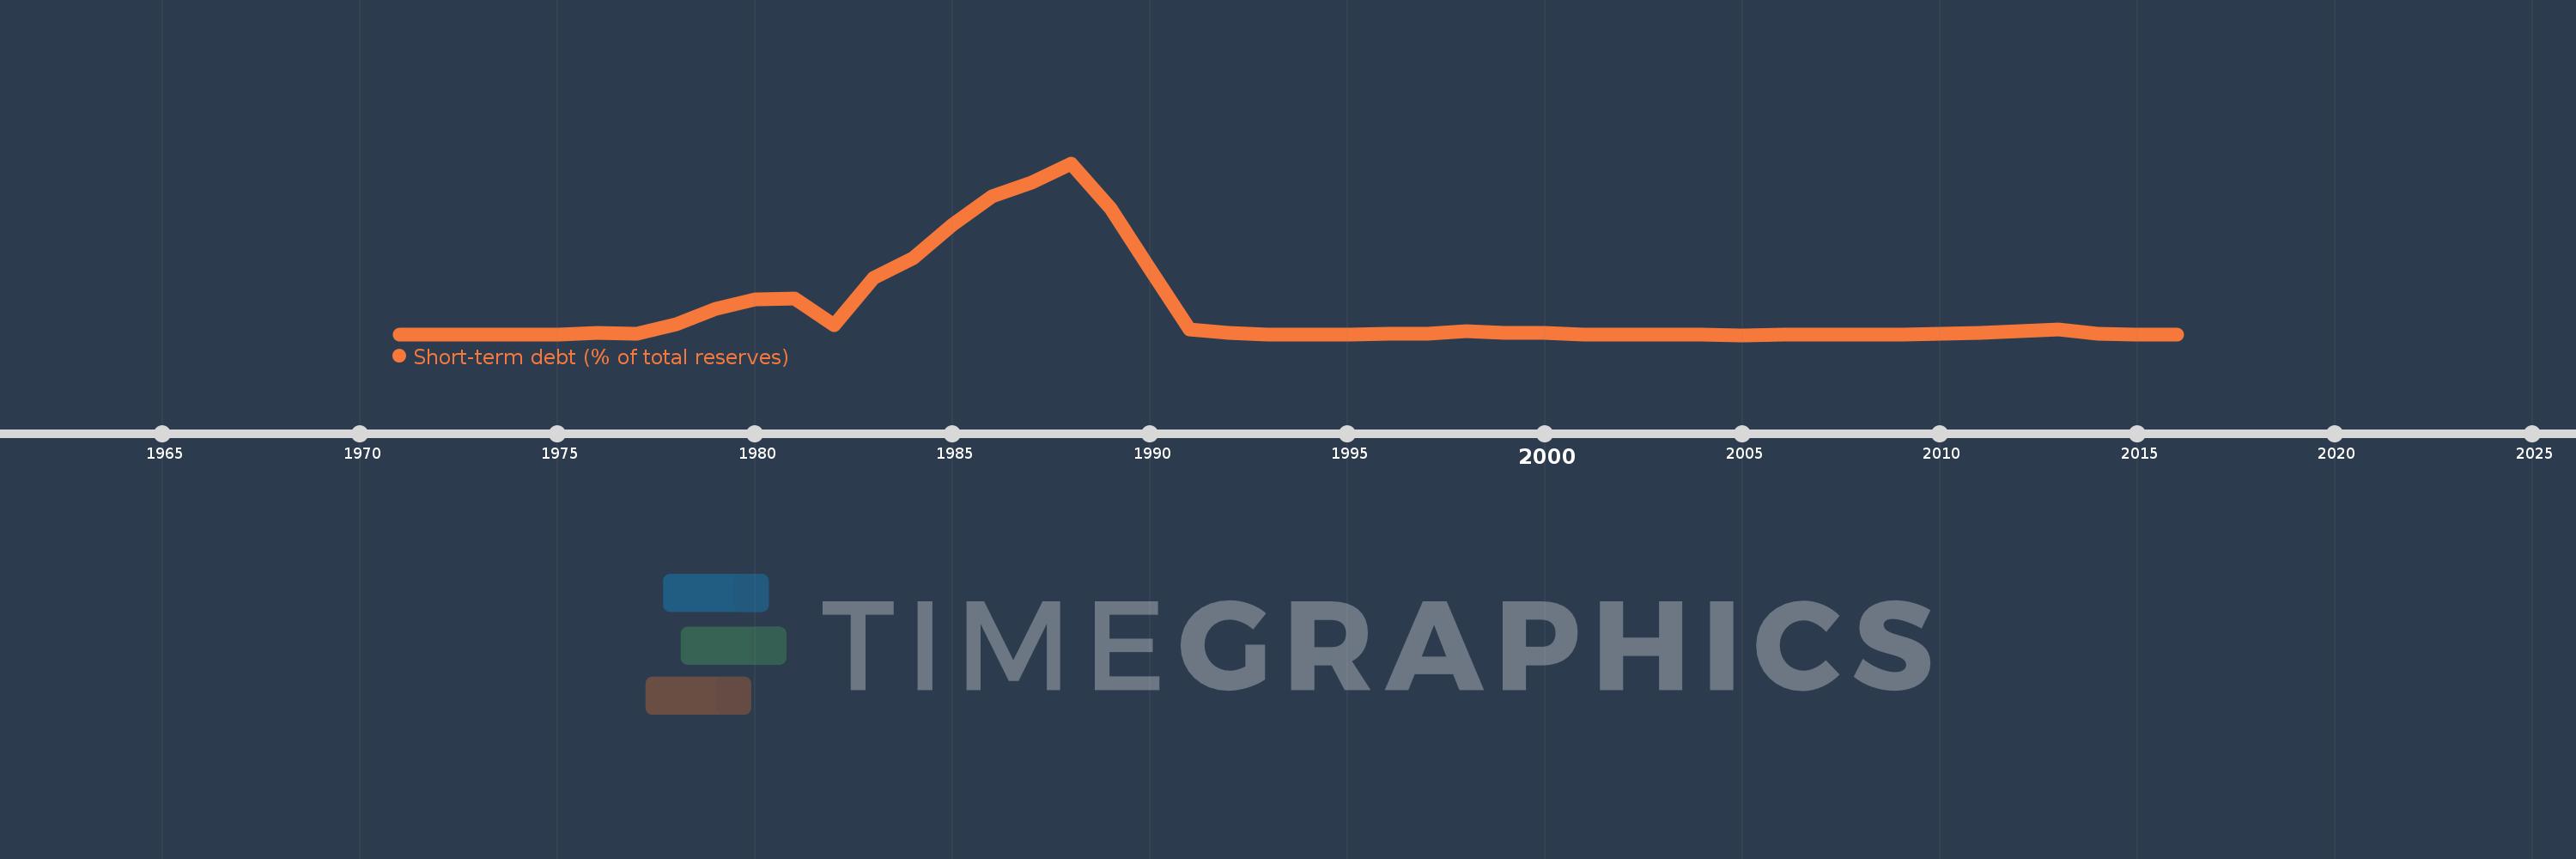
Short-term debt (% of total reserves)
2016,2015,2014,2013,2012,2011,2010,2009,2008,2007,2006,2005,2004,2003,2002,2001,2000,1999,1998,1997,1996,1995,1994,1993,1992,1991,1990,1989,1988,1987,1986,1985,1984,1983,1982,1981,1980,1979,1978,1977,1976,1975,1974,1973,1972,1971
This statistics in other country:
Timeline:
This timeline shows a graph from 1971 to 2016 of Benin. No data until 1970. Number of actual observations by date: 46.
Source name:
World Development Indicators
Source organization:
World Bank, International Debt Statistics.
Categories, topics:
Economy & Growth, External Debt
Last updated:
apr 23, 2017
Indicators value changes by year
Maximum:
2.342K
jan 1, 1988
At the date of observation
Value
Absolute change
Change from previous value
jan 1, 1971
5.667
+5.667
0.0%
jan 1, 1972
4.972
-0.695
-12.26%
jan 1, 1973
7.087
+2.115
42.54%
jan 1, 1974
8.815
+1.727
24.37%
jan 1, 1975
11.768
+2.953
33.5%
jan 1, 1976
35.118
+23.35
198.42%
jan 1, 1977
25.906
-9.213
-26.23%
jan 1, 1978
152.411
+126.505
488.33%
jan 1, 1979
356.963
+204.552
134.21%
jan 1, 1980
490.883
+133.92
37.52%
jan 1, 1981
499.748
+8.865
1.81%
jan 1, 1982
136.121
-363.627
-72.76%
jan 1, 1983
781.756
+645.635
474.31%
jan 1, 1984
1.053K
+271.381
34.71%
jan 1, 1985
1.507K
+454.339
43.14%
jan 1, 1986
1.886K
+378.506
25.11%
jan 1, 1987
2.08K
+193.583
10.26%
jan 1, 1988
2.342K
+262.104
12.6%
jan 1, 1989
1.725K
-616.915
-26.35%
jan 1, 1990
901.714
-823.04
-47.72%
jan 1, 1991
80.268
-821.447
-91.1%
jan 1, 1992
31.637
-48.631
-60.59%
jan 1, 1993
11.059
-20.577
-65.04%
jan 1, 1994
13.332
+2.272
20.54%
jan 1, 1995
11.788
-1.543
-11.58%
jan 1, 1996
23.746
+11.958
101.44%
jan 1, 1997
17.906
-5.84
-24.59%
jan 1, 1998
53.797
+35.891
200.44%
jan 1, 1999
32.868
-20.929
-38.9%
jan 1, 2000
30.51
-2.359
-7.18%
jan 1, 2001
14.452
-16.058
-52.63%
jan 1, 2002
13.816
-0.636
-4.4%
jan 1, 2003
12.709
-1.107
-8.01%
jan 1, 2004
4.883
-7.826
-61.58%
jan 1, 2005
4.008
-0.875
-17.92%
jan 1, 2006
6.246
+2.238
55.85%
jan 1, 2007
4.484
-1.762
-28.21%
jan 1, 2008
9.668
+5.184
115.6%
jan 1, 2009
7.072
-2.596
-26.85%
jan 1, 2010
17.333
+10.261
145.09%
jan 1, 2011
28.383
+11.049
63.75%
jan 1, 2012
55.973
+27.591
97.21%
jan 1, 2013
76.005
+20.032
35.79%
jan 1, 2014
27.258
-48.748
-64.14%
jan 1, 2015
8.066
-19.192
-70.41%
jan 1, 2016
10.712
+2.646
32.81%
Ranking of countries by current statistics by years


Comments: