29
/
en
AIzaSyAYiBZKx7MnpbEhh9jyipgxe19OcubqV5w
April 1, 2024
246319
South Africa
ZAF
true
2
1
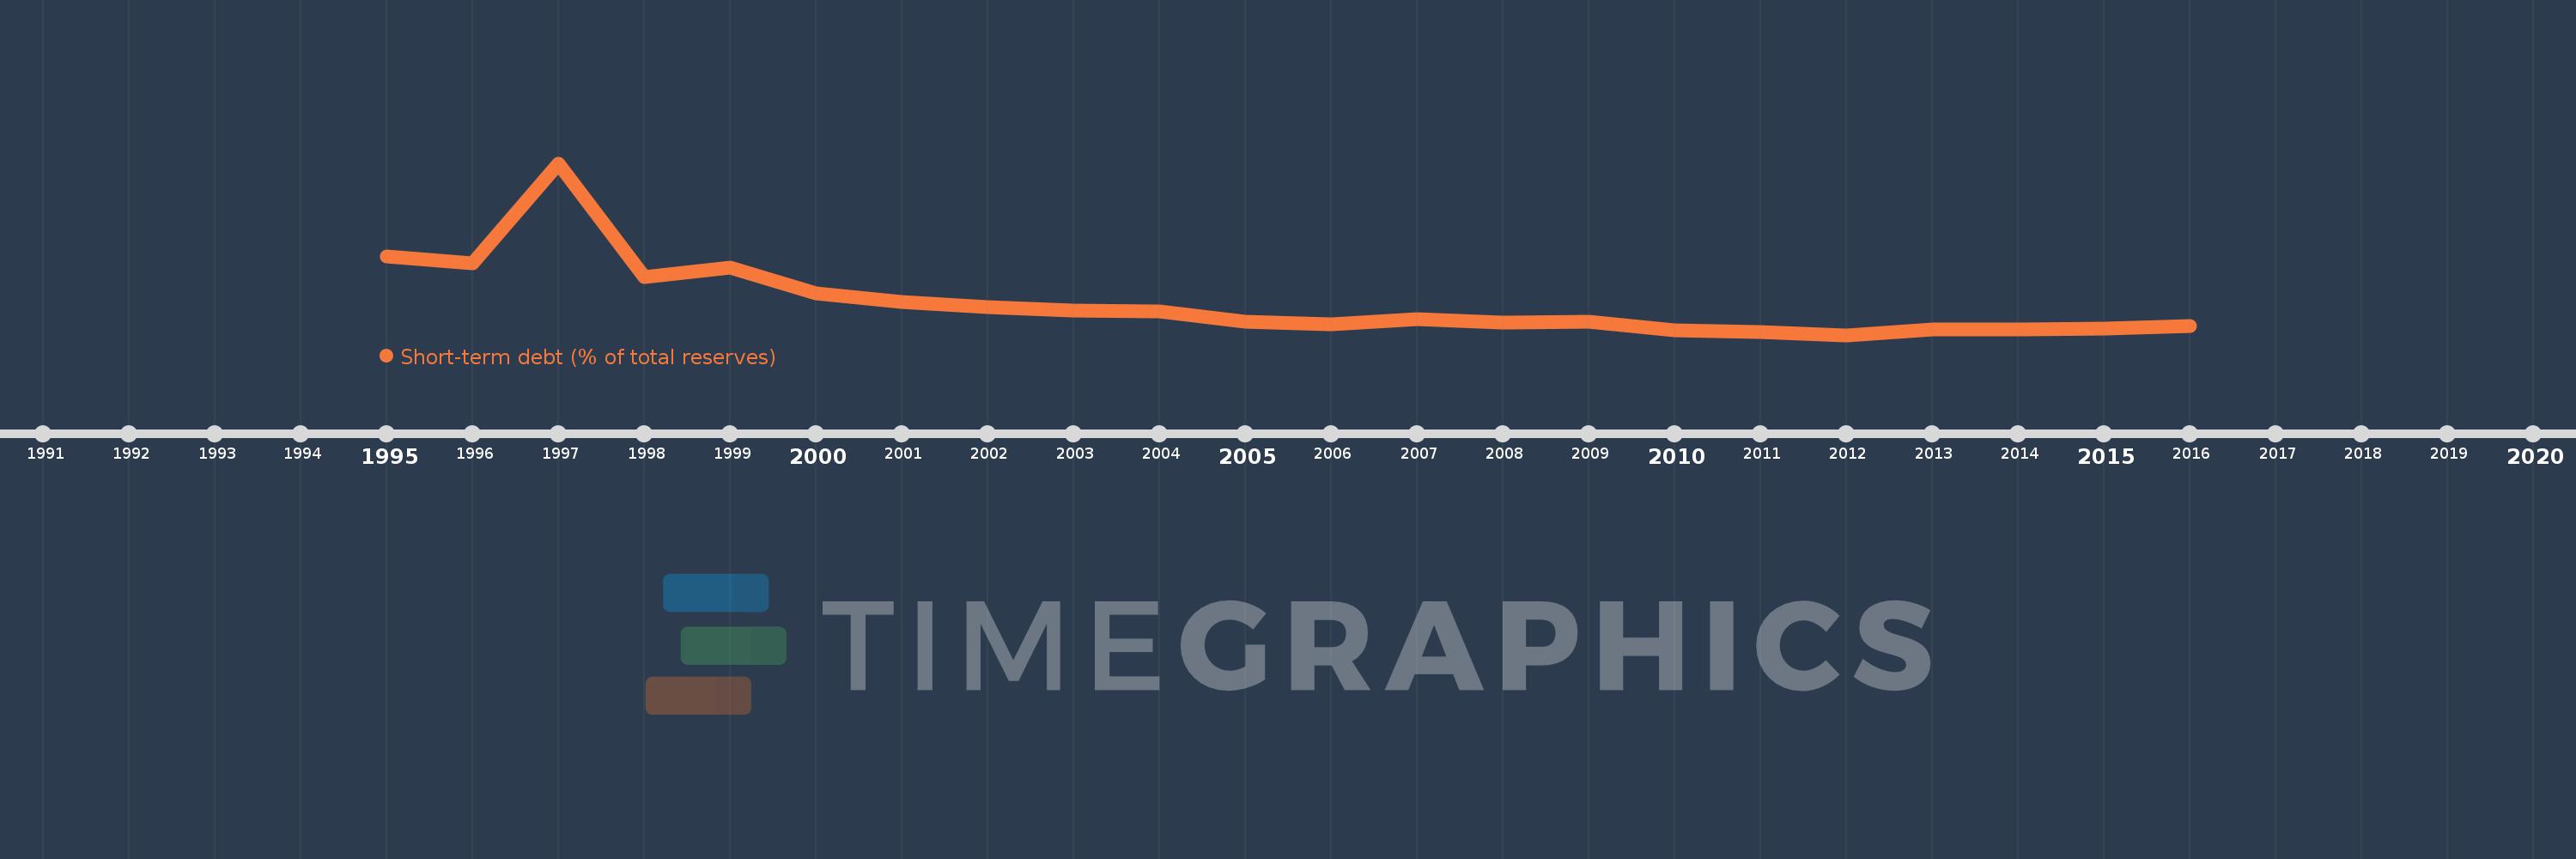
Short-term debt (% of total reserves)
2016,2015,2014,2013,2012,2011,2010,2009,2008,2007,2006,2005,2004,2003,2002,2001,2000,1999,1998,1997,1996,1995
This statistics in other country:
Timeline:
This timeline shows a graph from 1995 to 2016 of South Africa. No data until 1994. Number of actual observations by date: 22.
Source name:
World Development Indicators
Source organization:
World Bank, International Debt Statistics.
Categories, topics:
Economy & Growth, External Debt
Last updated:
apr 23, 2017
Indicators value changes by year
Minimum:
42.123
jan 1, 2012
Maximum:
462.705
jan 1, 1997
At the date of observation
Value
Absolute change
Change from previous value
jan 1, 1995
234.88
+234.88
0.0%
jan 1, 1996
216.711
-18.17
-7.74%
jan 1, 1997
462.705
+245.995
113.51%
jan 1, 1998
183.438
-279.267
-60.36%
jan 1, 1999
207.768
+24.33
13.26%
jan 1, 2000
144.264
-63.505
-30.57%
jan 1, 2001
124.032
-20.232
-14.02%
jan 1, 2002
109.547
-14.485
-11.68%
jan 1, 2003
103.035
-6.512
-5.94%
jan 1, 2004
100.772
-2.263
-2.2%
jan 1, 2005
75.204
-25.568
-25.37%
jan 1, 2006
69.219
-5.985
-7.96%
jan 1, 2007
80.357
+11.138
16.09%
jan 1, 2008
73.039
-7.318
-9.11%
jan 1, 2009
74.734
+1.695
2.32%
jan 1, 2010
53.749
-20.985
-28.08%
jan 1, 2011
49.59
-4.159
-7.74%
jan 1, 2012
42.123
-7.467
-15.06%
jan 1, 2013
54.979
+12.857
30.52%
jan 1, 2014
54.818
-0.161
-0.29%
jan 1, 2015
57.087
+2.269
4.14%
jan 1, 2016
63.362
+6.275
10.99%
Ranking of countries by current statistics by years


Comments: