29
/
en
AIzaSyAYiBZKx7MnpbEhh9jyipgxe19OcubqV5w
April 1, 2024
62210
Upper middle income
UMC
false
2
1
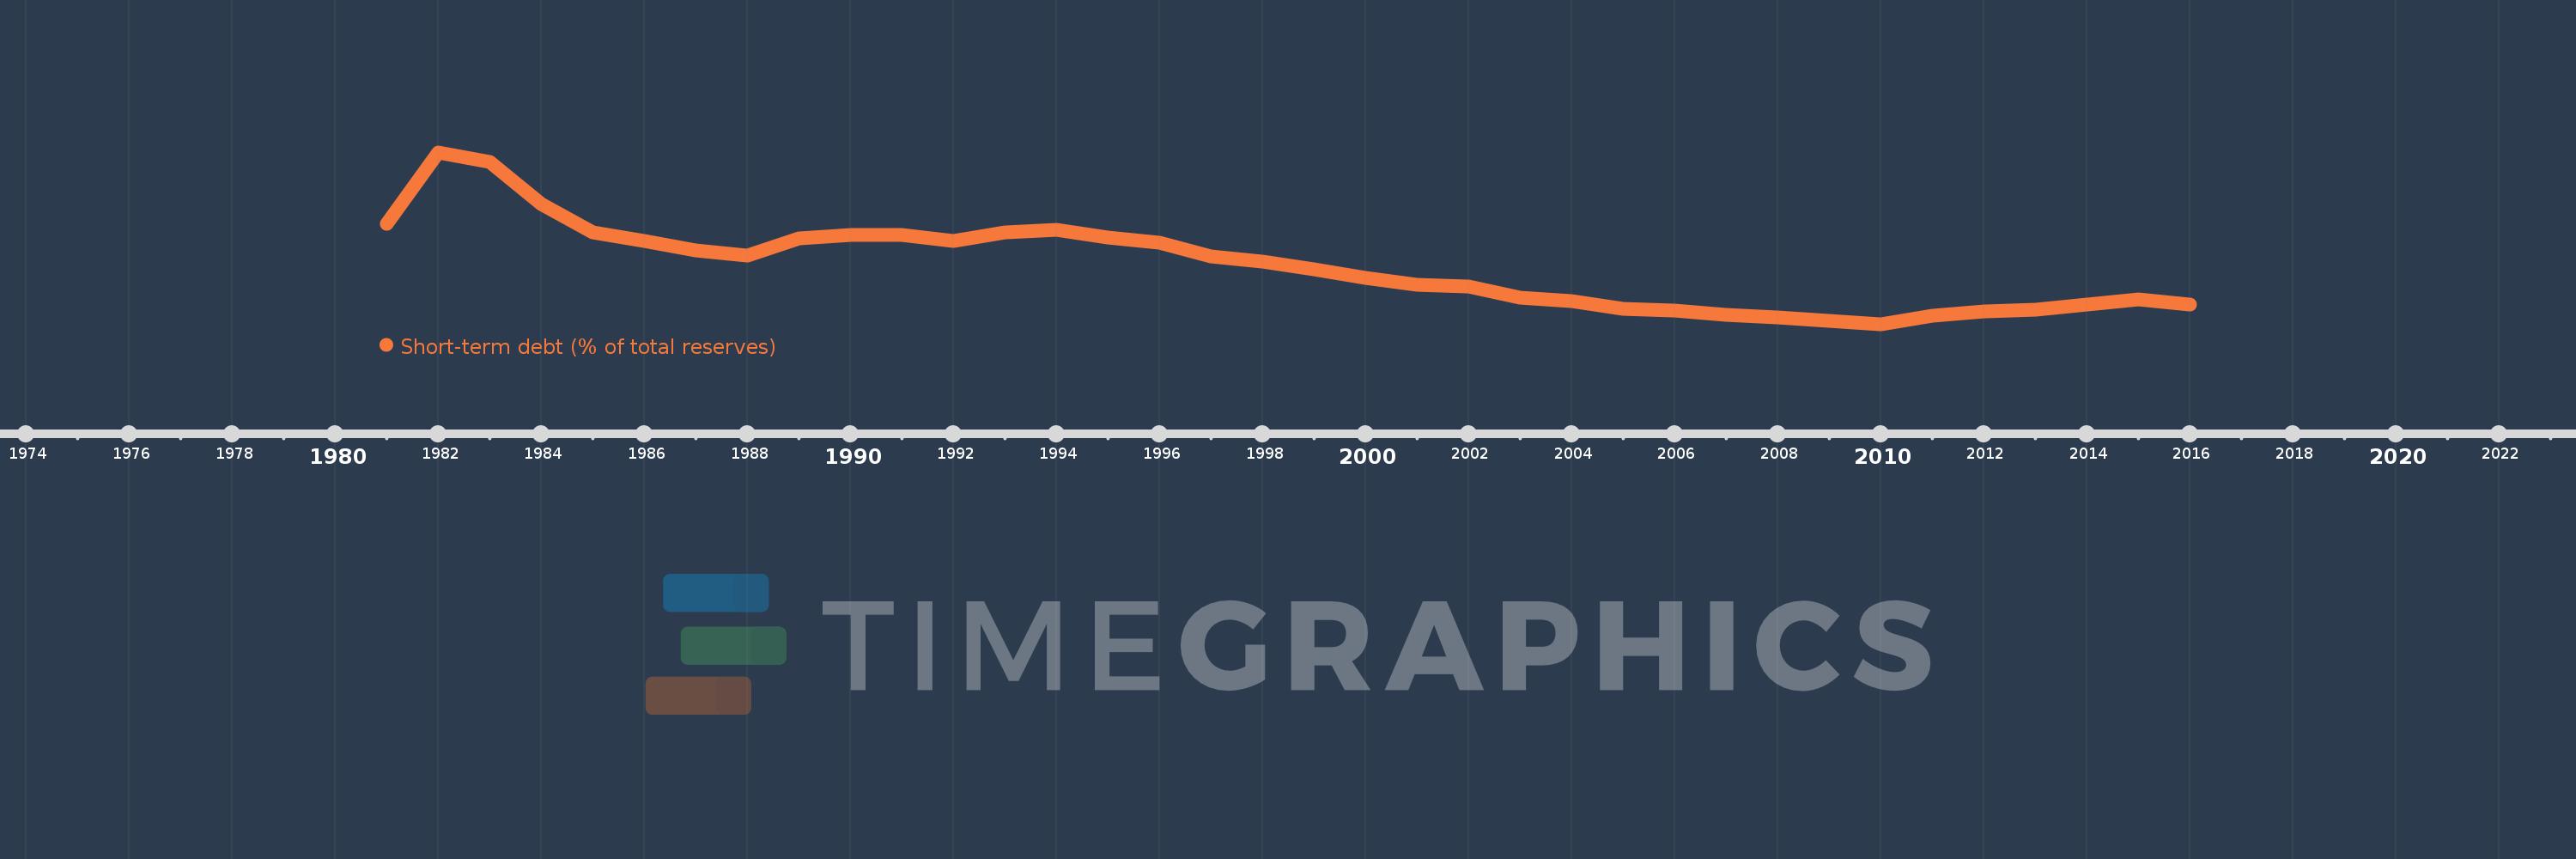
Short-term debt (% of total reserves)
2016,2015,2014,2013,2012,2011,2010,2009,2008,2007,2006,2005,2004,2003,2002,2001,2000,1999,1998,1997,1996,1995,1994,1993,1992,1991,1990,1989,1988,1987,1986,1985,1984,1983,1982,1981
This statistics in other country:
Timeline:
This timeline shows a graph from 1981 to 2016 of Upper middle income. No data until 1980. Number of actual observations by date: 36.
Source name:
World Development Indicators
Source organization:
World Bank, International Debt Statistics.
Categories, topics:
Economy & Growth, External Debt
Last updated:
apr 23, 2017
Indicators value changes by year
Minimum:
16.259
jan 1, 2010
Maximum:
132.249
jan 1, 1982
At the date of observation
Value
Absolute change
Change from previous value
jan 1, 1981
84.29
+84.29
0.0%
jan 1, 1982
132.249
+47.96
56.9%
jan 1, 1983
125.807
-6.443
-4.87%
jan 1, 1984
97.377
-28.43
-22.6%
jan 1, 1985
78.5
-18.877
-19.39%
jan 1, 1986
72.537
-5.963
-7.6%
jan 1, 1987
66.157
-6.38
-8.8%
jan 1, 1988
62.712
-3.445
-5.21%
jan 1, 1989
74.009
+11.297
18.01%
jan 1, 1990
76.375
+2.366
3.2%
jan 1, 1991
76.742
+0.367
0.48%
jan 1, 1992
72.21
-4.532
-5.91%
jan 1, 1993
78.229
+6.019
8.34%
jan 1, 1994
79.753
+1.524
1.95%
jan 1, 1995
74.674
-5.079
-6.37%
jan 1, 1996
71.101
-3.573
-4.79%
jan 1, 1997
61.993
-9.108
-12.81%
jan 1, 1998
58.439
-3.554
-5.73%
jan 1, 1999
53.331
-5.109
-8.74%
jan 1, 2000
47.763
-5.567
-10.44%
jan 1, 2001
42.832
-4.931
-10.32%
jan 1, 2002
41.62
-1.212
-2.83%
jan 1, 2003
34.462
-7.158
-17.2%
jan 1, 2004
31.83
-2.632
-7.64%
jan 1, 2005
26.924
-4.906
-15.41%
jan 1, 2006
25.706
-1.218
-4.53%
jan 1, 2007
22.391
-3.315
-12.9%
jan 1, 2008
20.798
-1.593
-7.11%
jan 1, 2009
18.321
-2.477
-11.91%
jan 1, 2010
16.259
-2.062
-11.26%
jan 1, 2011
21.988
+5.728
35.23%
jan 1, 2012
25.138
+3.151
14.33%
jan 1, 2013
25.956
+0.818
3.25%
jan 1, 2014
29.711
+3.754
14.46%
jan 1, 2015
32.844
+3.134
10.55%
jan 1, 2016
29.613
-3.232
-9.84%
Ranking of countries by current statistics by years


Comments: