29
/
en
AIzaSyAYiBZKx7MnpbEhh9jyipgxe19OcubqV5w
April 1, 2024
193693
Mauritania
MRT
true
2
1
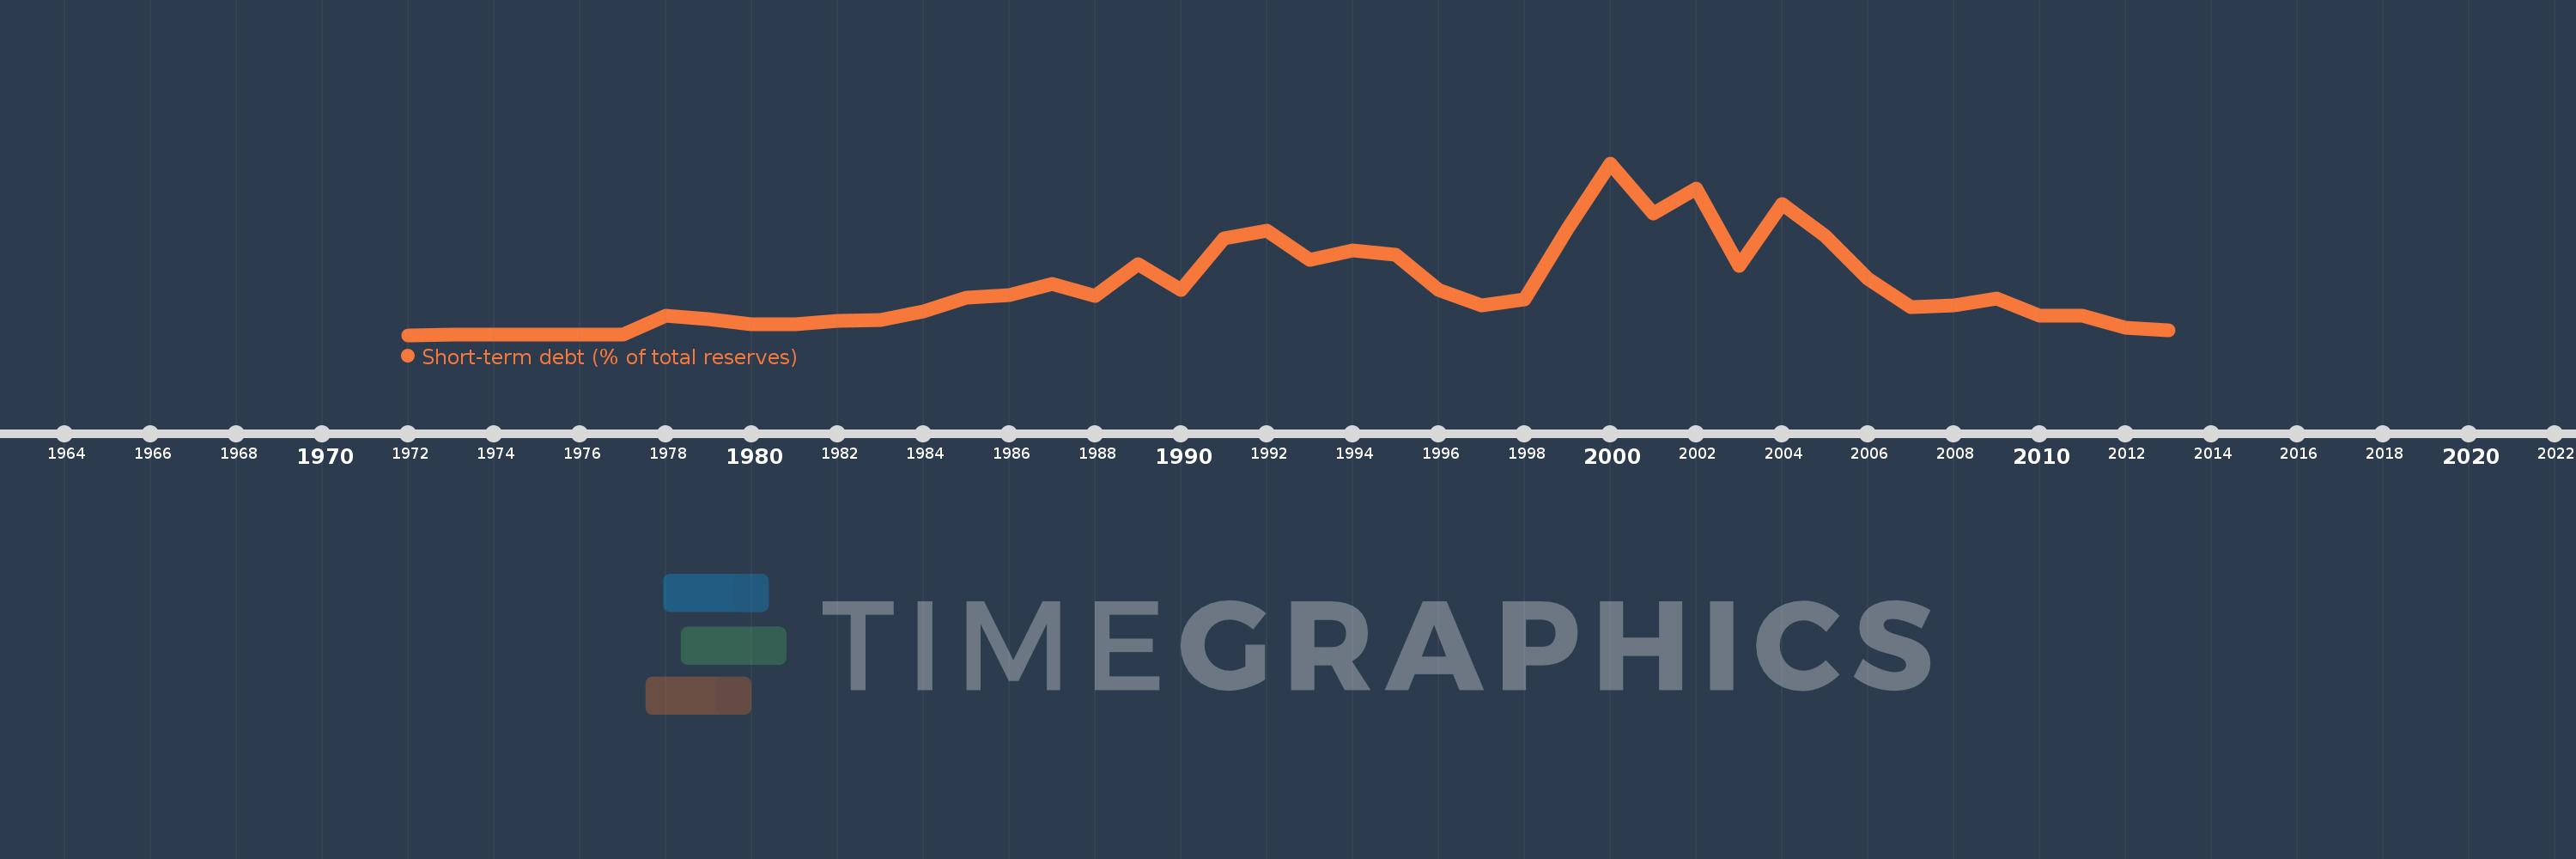
Short-term debt (% of total reserves)
2013,2012,2011,2010,2009,2008,2007,2006,2005,2004,2003,2002,2001,2000,1999,1998,1997,1996,1995,1994,1993,1992,1991,1990,1989,1988,1987,1986,1985,1984,1983,1982,1981,1980,1979,1978,1977,1976,1975,1974,1973,1972
This statistics in other country:
Timeline:
This timeline shows a graph from 1972 to 2013 of Mauritania. No data until 1971. Number of actual observations by date: 42.
Source name:
World Development Indicators
Source organization:
World Bank, International Debt Statistics.
Categories, topics:
Economy & Growth, External Debt
Last updated:
apr 23, 2017
Indicators value changes by year
Maximum:
719.537
jan 1, 2000
At the date of observation
Value
Absolute change
Change from previous value
jan 1, 1972
0.04
+0.04
0.0%
jan 1, 1973
0.765
+0.725
1.81K%
jan 1, 1974
0.41
-0.356
-46.48%
jan 1, 1975
0.083
-0.327
-79.77%
jan 1, 1976
0.409
+0.326
393.21%
jan 1, 1977
0.265
-0.144
-35.22%
jan 1, 1978
81.489
+81.225
30.69K%
jan 1, 1979
65.768
-15.722
-19.29%
jan 1, 1980
43.503
-22.265
-33.85%
jan 1, 1981
44.403
+0.901
2.07%
jan 1, 1982
59.157
+14.753
33.23%
jan 1, 1983
64.472
+5.315
8.98%
jan 1, 1984
97.328
+32.856
50.96%
jan 1, 1985
156.116
+58.788
60.4%
jan 1, 1986
167.885
+11.769
7.54%
jan 1, 1987
215.863
+47.978
28.58%
jan 1, 1988
163.088
-52.775
-24.45%
jan 1, 1989
295.131
+132.043
80.96%
jan 1, 1990
188.603
-106.527
-36.09%
jan 1, 1991
405.843
+217.24
115.18%
jan 1, 1992
436.025
+30.182
7.44%
jan 1, 1993
315.691
-120.334
-27.6%
jan 1, 1994
354.846
+39.155
12.4%
jan 1, 1995
335.537
-19.309
-5.44%
jan 1, 1996
187.906
-147.631
-44.0%
jan 1, 1997
123.803
-64.104
-34.11%
jan 1, 1998
148.849
+25.046
20.23%
jan 1, 1999
444.826
+295.978
198.84%
jan 1, 2000
719.537
+274.711
61.76%
jan 1, 2001
508.141
-211.396
-29.38%
jan 1, 2002
613.527
+105.386
20.74%
jan 1, 2003
290.381
-323.146
-52.67%
jan 1, 2004
547.106
+256.725
88.41%
jan 1, 2005
414.547
-132.559
-24.23%
jan 1, 2006
237.359
-177.188
-42.74%
jan 1, 2007
117.553
-119.805
-50.47%
jan 1, 2008
122.537
+4.983
4.24%
jan 1, 2009
151.461
+28.925
23.6%
jan 1, 2010
80.611
-70.85
-46.78%
jan 1, 2011
82.445
+1.834
2.27%
jan 1, 2012
30.02
-52.424
-63.59%
jan 1, 2013
20.254
-9.766
-32.53%
Ranking of countries by current statistics by years


Comments: