29
/
en
AIzaSyAYiBZKx7MnpbEhh9jyipgxe19OcubqV5w
April 1, 2024
39557
IDA only
IDX
false
2
1
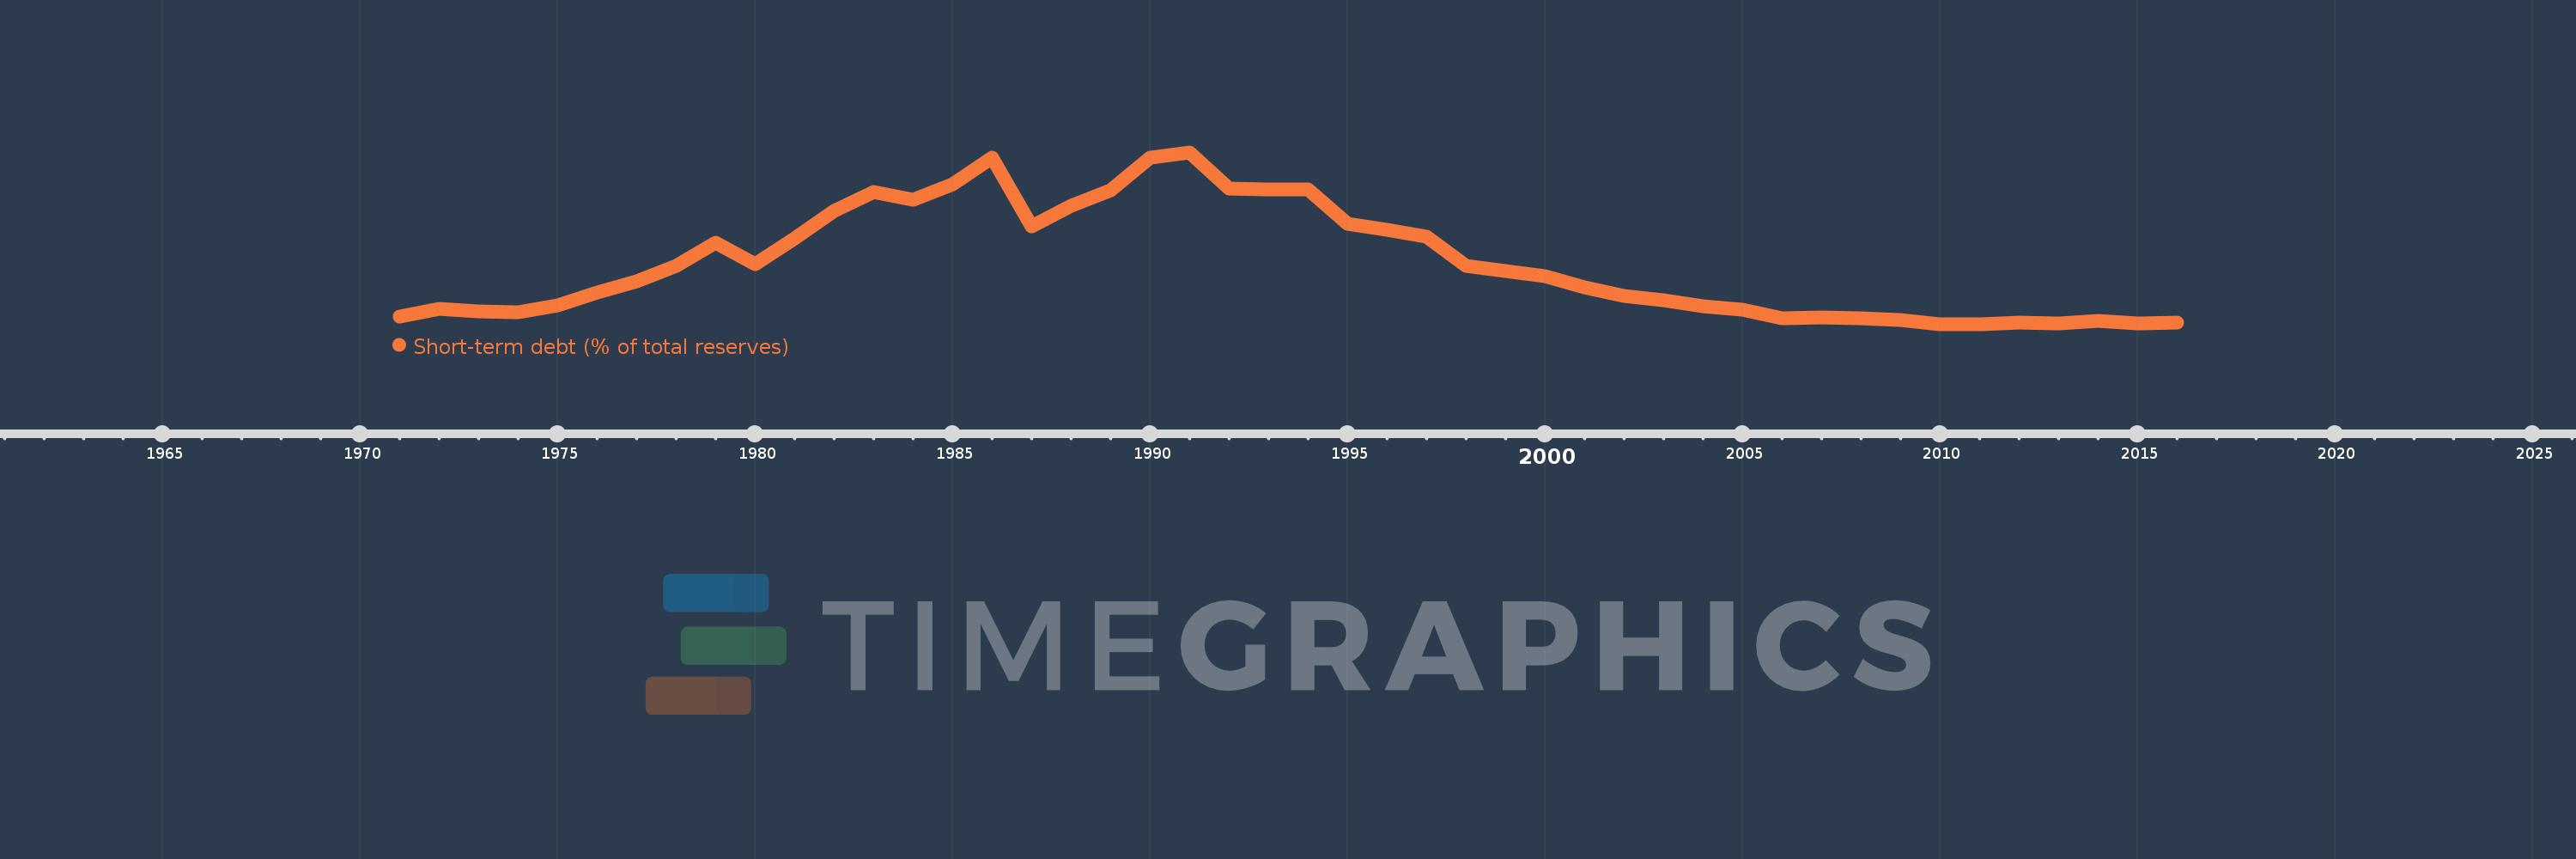
Short-term debt (% of total reserves)
2016,2015,2014,2013,2012,2011,2010,2009,2008,2007,2006,2005,2004,2003,2002,2001,2000,1999,1998,1997,1996,1995,1994,1993,1992,1991,1990,1989,1988,1987,1986,1985,1984,1983,1982,1981,1980,1979,1978,1977,1976,1975,1974,1973,1972,1971
This statistics in other country:
Timeline:
This timeline shows a graph from 1971 to 2016 of IDA only. No data until 1970. Number of actual observations by date: 46.
Source name:
World Development Indicators
Source organization:
World Bank, International Debt Statistics.
Categories, topics:
Economy & Growth, External Debt
Last updated:
apr 23, 2017
Indicators value changes by year
Maximum:
303.039
jan 1, 1991
At the date of observation
Value
Absolute change
Change from previous value
jan 1, 1971
35.673
+35.673
0.0%
jan 1, 1972
48.401
+12.728
35.68%
jan 1, 1973
44.17
-4.231
-8.74%
jan 1, 1974
42.701
-1.469
-3.33%
jan 1, 1975
53.623
+10.922
25.58%
jan 1, 1976
74.222
+20.6
38.42%
jan 1, 1977
93.33
+19.107
25.74%
jan 1, 1978
118.325
+24.996
26.78%
jan 1, 1979
155.984
+37.659
31.83%
jan 1, 1980
120.604
-35.38
-22.68%
jan 1, 1981
163.178
+42.574
35.3%
jan 1, 1982
207.759
+44.581
27.32%
jan 1, 1983
238.409
+30.65
14.75%
jan 1, 1984
226.303
-12.106
-5.08%
jan 1, 1985
251.319
+25.016
11.05%
jan 1, 1986
294.303
+42.983
17.1%
jan 1, 1987
182.144
-112.159
-38.11%
jan 1, 1988
215.728
+33.584
18.44%
jan 1, 1989
241.578
+25.85
11.98%
jan 1, 1990
294.017
+52.439
21.71%
jan 1, 1991
303.039
+9.023
3.07%
jan 1, 1992
243.691
-59.348
-19.58%
jan 1, 1993
243.14
-0.551
-0.23%
jan 1, 1994
242.087
-1.053
-0.43%
jan 1, 1995
186.146
-55.941
-23.11%
jan 1, 1996
176.242
-9.903
-5.32%
jan 1, 1997
165.606
-10.637
-6.04%
jan 1, 1998
117.443
-48.163
-29.08%
jan 1, 1999
109.088
-8.355
-7.11%
jan 1, 2000
101.087
-8.0
-7.33%
jan 1, 2001
82.972
-18.116
-17.92%
jan 1, 2002
69.647
-13.325
-16.06%
jan 1, 2003
62.215
-7.432
-10.67%
jan 1, 2004
51.661
-10.554
-16.96%
jan 1, 2005
47.202
-4.459
-8.63%
jan 1, 2006
32.144
-15.058
-31.9%
jan 1, 2007
33.395
+1.252
3.89%
jan 1, 2008
32.112
-1.283
-3.84%
jan 1, 2009
29.713
-2.399
-7.47%
jan 1, 2010
23.29
-6.423
-21.62%
jan 1, 2011
22.99
-0.3
-1.29%
jan 1, 2012
25.598
+2.608
11.34%
jan 1, 2013
24.842
-0.756
-2.95%
jan 1, 2014
27.925
+3.083
12.41%
jan 1, 2015
24.383
-3.542
-12.68%
jan 1, 2016
25.513
+1.13
4.64%
Ranking of countries by current statistics by years


Comments: