29
/
en
AIzaSyAYiBZKx7MnpbEhh9jyipgxe19OcubqV5w
April 1, 2024
122878
Dominican Republic
DOM
true
2
1
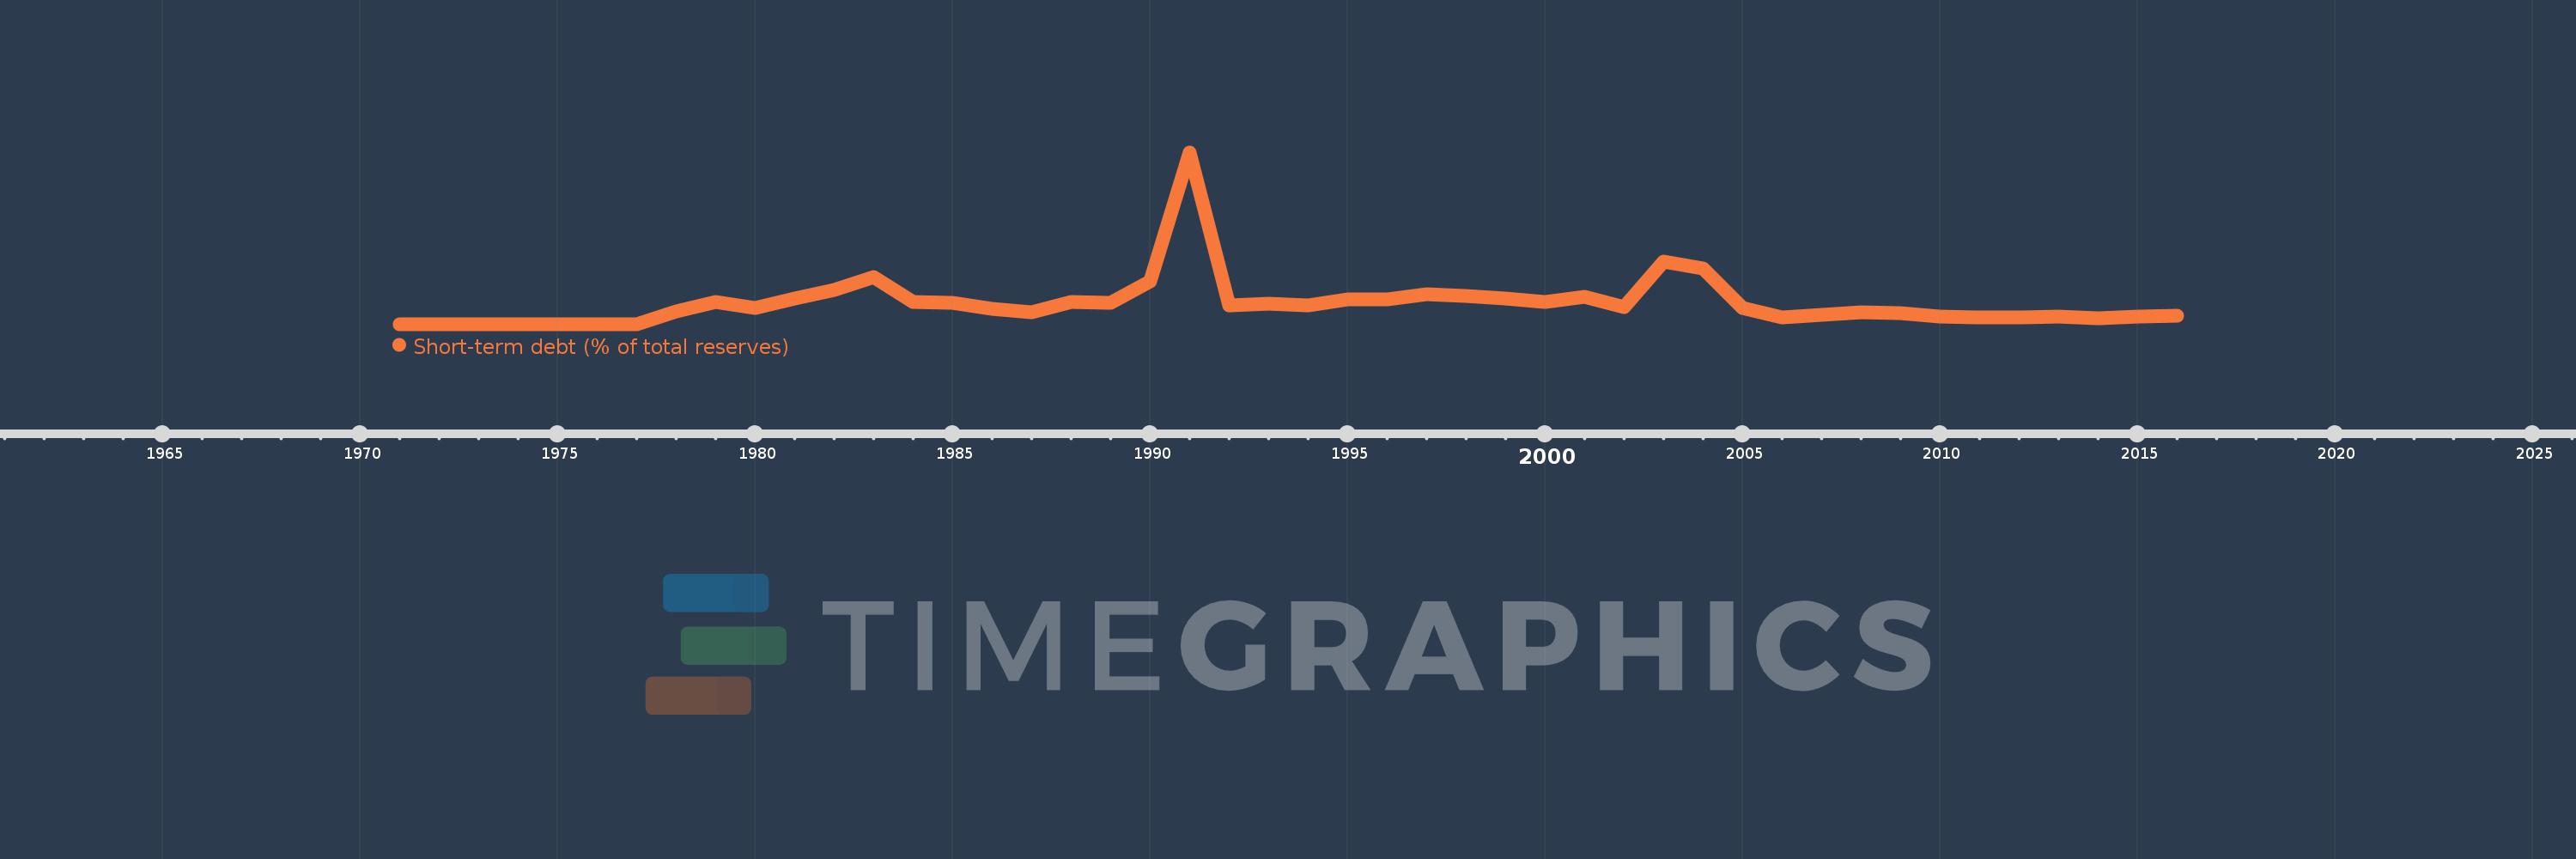
Short-term debt (% of total reserves)
2016,2015,2014,2013,2012,2011,2010,2009,2008,2007,2006,2005,2004,2003,2002,2001,2000,1999,1998,1997,1996,1995,1994,1993,1992,1991,1990,1989,1988,1987,1986,1985,1984,1983,1982,1981,1980,1979,1978,1977,1976,1975,1974,1973,1972,1971
This statistics in other country:
Timeline:
This timeline shows a graph from 1971 to 2016 of Dominican Republic. No data until 1970. Number of actual observations by date: 46.
Source name:
World Development Indicators
Source organization:
World Bank, International Debt Statistics.
Categories, topics:
Economy & Growth, External Debt
Last updated:
apr 23, 2017
Indicators value changes by year
Maximum:
1.141K
jan 1, 1991
At the date of observation
Value
Absolute change
Change from previous value
jan 1, 1971
0.631
+0.631
0.0%
jan 1, 1972
1.468
+0.837
132.62%
jan 1, 1973
1.782
+0.314
21.4%
jan 1, 1974
0.593
-1.189
-66.74%
jan 1, 1975
0.28
-0.312
-52.73%
jan 1, 1976
0.494
+0.214
76.33%
jan 1, 1977
1.519
+1.025
207.53%
jan 1, 1978
84.794
+83.275
5.48K%
jan 1, 1979
145.372
+60.578
71.44%
jan 1, 1980
107.708
-37.664
-25.91%
jan 1, 1981
172.166
+64.458
59.85%
jan 1, 1982
226.491
+54.325
31.55%
jan 1, 1983
311.261
+84.769
37.43%
jan 1, 1984
148.418
-162.843
-52.32%
jan 1, 1985
143.235
-5.183
-3.49%
jan 1, 1986
105.147
-38.089
-26.59%
jan 1, 1987
80.104
-25.043
-23.82%
jan 1, 1988
150.098
+69.995
87.38%
jan 1, 1989
142.827
-7.271
-4.84%
jan 1, 1990
287.226
+144.399
101.1%
jan 1, 1991
1.141K
+854.182
297.39%
jan 1, 1992
125.381
-1.016K
-89.02%
jan 1, 1993
135.838
+10.457
8.34%
jan 1, 1994
126.336
-9.501
-6.99%
jan 1, 1995
166.255
+39.919
31.6%
jan 1, 1996
165.27
-0.985
-0.59%
jan 1, 1997
197.958
+32.688
19.78%
jan 1, 1998
189.315
-8.643
-4.37%
jan 1, 1999
170.584
-18.731
-9.89%
jan 1, 2000
149.742
-20.842
-12.22%
jan 1, 2001
180.94
+31.198
20.83%
jan 1, 2002
113.724
-67.216
-37.15%
jan 1, 2003
413.547
+299.823
263.64%
jan 1, 2004
368.982
-44.565
-10.78%
jan 1, 2005
110.774
-258.208
-69.98%
jan 1, 2006
45.969
-64.806
-58.5%
jan 1, 2007
61.325
+15.356
33.41%
jan 1, 2008
81.451
+20.127
32.82%
jan 1, 2009
71.99
-9.461
-11.62%
jan 1, 2010
49.016
-22.974
-31.91%
jan 1, 2011
45.278
-3.738
-7.63%
jan 1, 2012
43.748
-1.53
-3.38%
jan 1, 2013
49.268
+5.52
12.62%
jan 1, 2014
37.294
-11.975
-24.3%
jan 1, 2015
51.133
+13.84
37.11%
jan 1, 2016
59.062
+7.929
15.51%
Ranking of countries by current statistics by years


Comments: