29
/
en
AIzaSyAYiBZKx7MnpbEhh9jyipgxe19OcubqV5w
April 1, 2024
59368
Sub-Saharan Africa
SSF
false
2
1
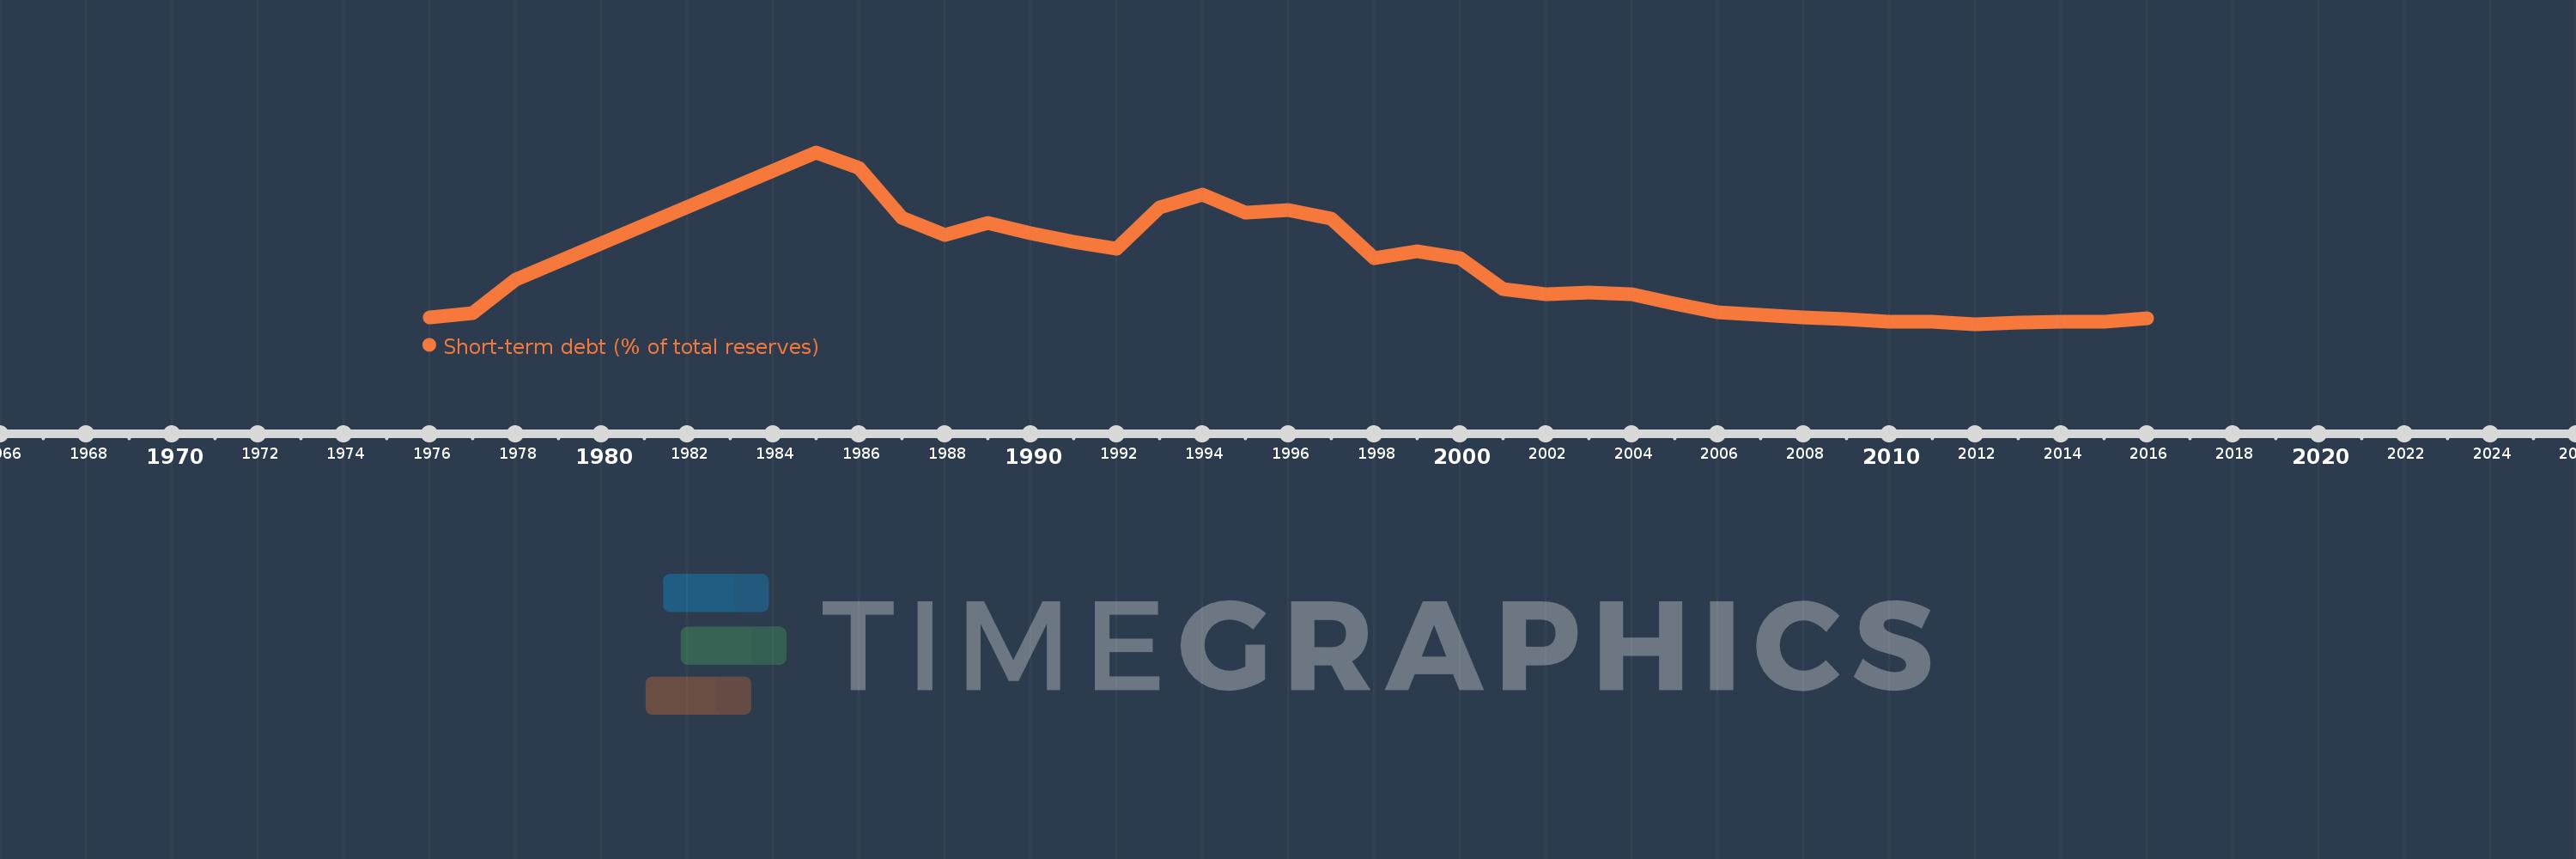
Short-term debt (% of total reserves)
2016,2015,2014,2013,2012,2011,2010,2009,2008,2007,2006,2005,2004,2003,2002,2001,2000,1999,1998,1997,1996,1995,1994,1993,1992,1991,1990,1989,1988,1987,1986,1985,1978,1977,1976
This statistics in other country:
Timeline:
This timeline shows a graph from 1976 to 2016 of Sub-Saharan Africa . No data until 1975. Number of actual observations by date: 35.
Source name:
World Development Indicators
Source organization:
World Bank, International Debt Statistics.
Categories, topics:
Economy & Growth, External Debt
Last updated:
apr 23, 2017
Indicators value changes by year
Minimum:
22.496
jan 1, 2012
Maximum:
279.958
jan 1, 1985
At the date of observation
Value
Absolute change
Change from previous value
jan 1, 1976
33.035
+33.035
0.0%
jan 1, 1977
39.588
+6.553
19.84%
jan 1, 1978
89.333
+49.745
125.66%
jan 1, 1985
279.958
+190.625
213.39%
jan 1, 1986
256.228
-23.73
-8.48%
jan 1, 1987
182.483
-73.745
-28.78%
jan 1, 1988
156.259
-26.224
-14.37%
jan 1, 1989
174.095
+17.836
11.41%
jan 1, 1990
159.157
-14.938
-8.58%
jan 1, 1991
145.407
-13.751
-8.64%
jan 1, 1992
136.24
-9.167
-6.3%
jan 1, 1993
197.327
+61.087
44.84%
jan 1, 1994
217.288
+19.962
10.12%
jan 1, 1995
190.361
-26.927
-12.39%
jan 1, 1996
193.687
+3.326
1.75%
jan 1, 1997
180.774
-12.913
-6.67%
jan 1, 1998
121.468
-59.306
-32.81%
jan 1, 1999
131.798
+10.33
8.5%
jan 1, 2000
120.86
-10.938
-8.3%
jan 1, 2001
74.747
-46.113
-38.15%
jan 1, 2002
67.373
-7.374
-9.87%
jan 1, 2003
70.418
+3.045
4.52%
jan 1, 2004
66.863
-3.555
-5.05%
jan 1, 2005
52.795
-14.067
-21.04%
jan 1, 2006
40.383
-12.412
-23.51%
jan 1, 2007
36.711
-3.672
-9.09%
jan 1, 2008
32.782
-3.928
-10.7%
jan 1, 2009
30.389
-2.394
-7.3%
jan 1, 2010
26.463
-3.926
-12.92%
jan 1, 2011
26.123
-0.34
-1.29%
jan 1, 2012
22.496
-3.627
-13.89%
jan 1, 2013
25.05
+2.554
11.35%
jan 1, 2014
25.914
+0.865
3.45%
jan 1, 2015
26.346
+0.432
1.67%
jan 1, 2016
31.361
+5.015
19.04%
Ranking of countries by current statistics by years


Comments: