29
/
en
AIzaSyAYiBZKx7MnpbEhh9jyipgxe19OcubqV5w
April 1, 2024
249472
Sri Lanka
LKA
true
2
1
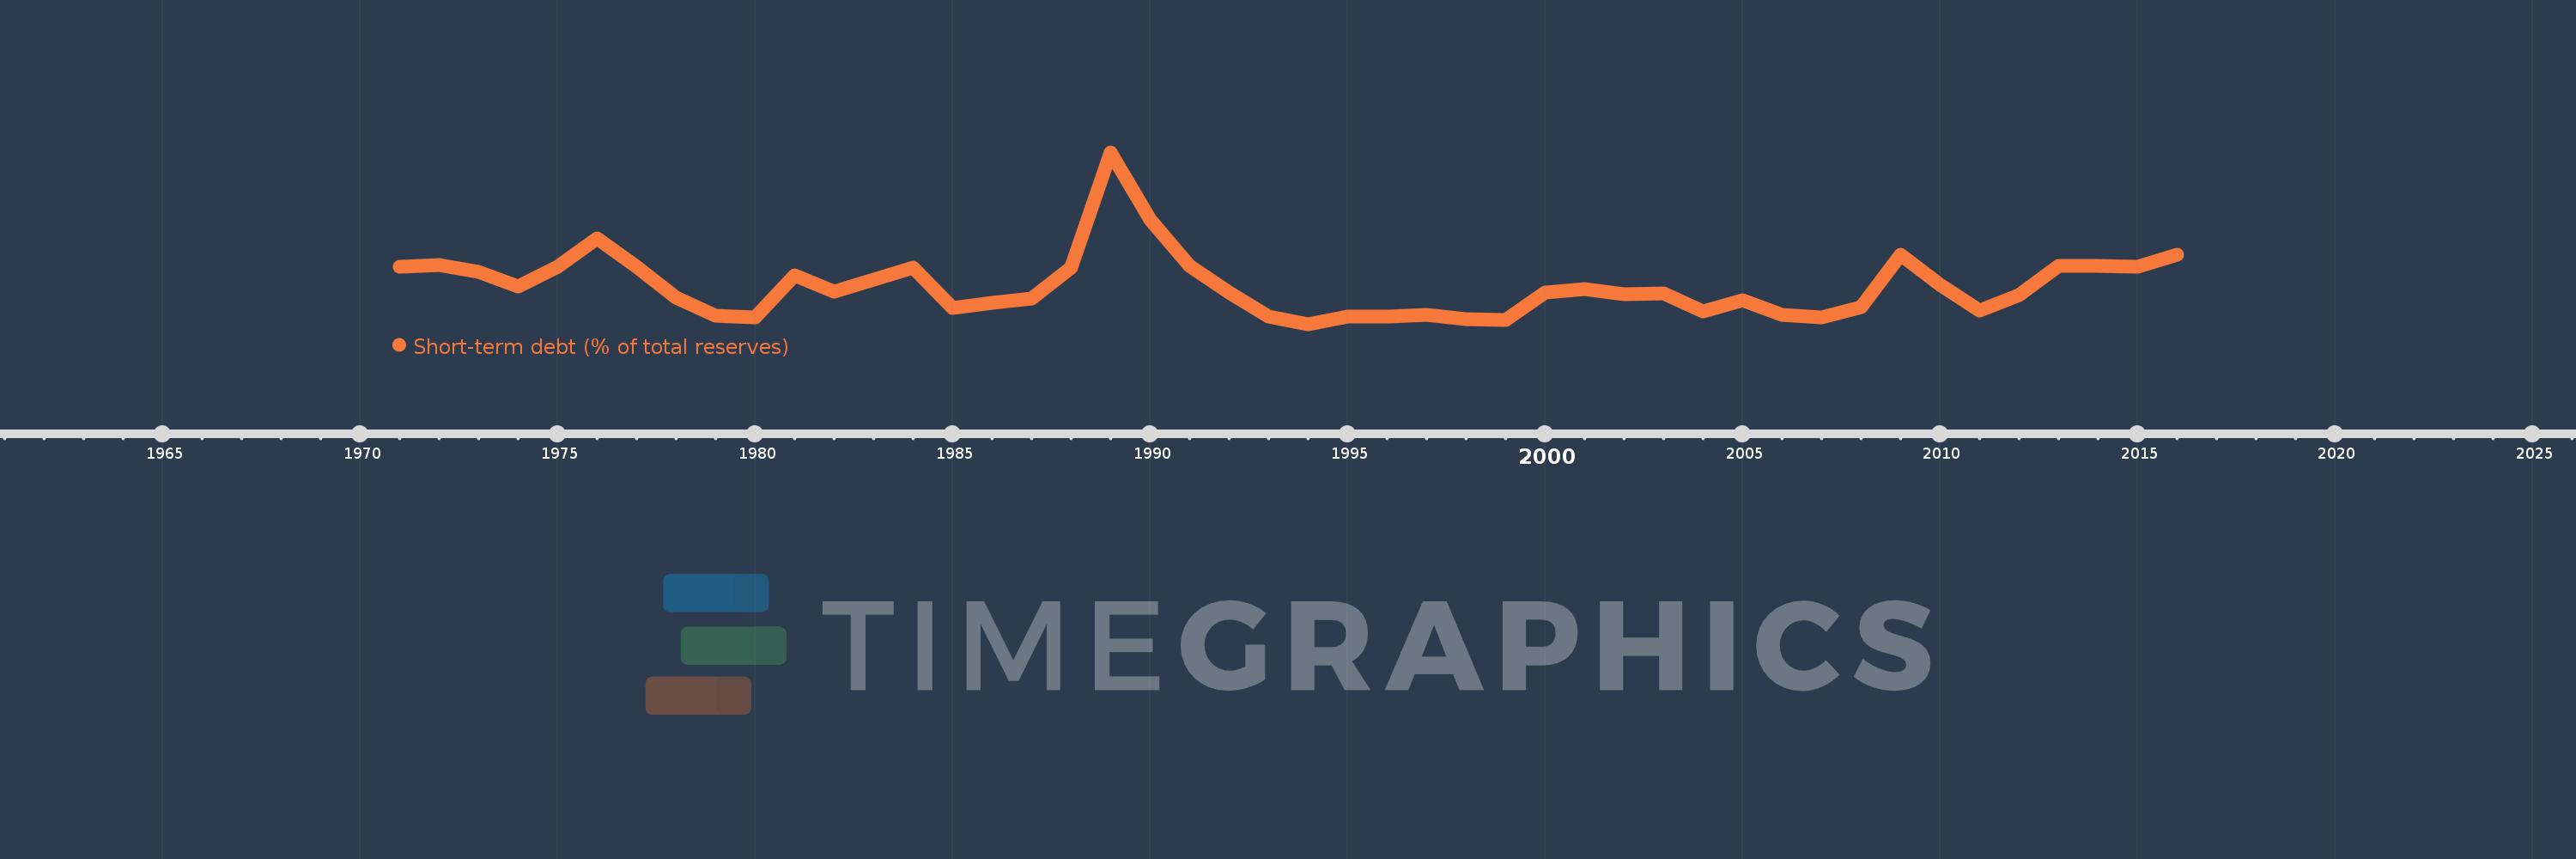
Short-term debt (% of total reserves)
2016,2015,2014,2013,2012,2011,2010,2009,2008,2007,2006,2005,2004,2003,2002,2001,2000,1999,1998,1997,1996,1995,1994,1993,1992,1991,1990,1989,1988,1987,1986,1985,1984,1983,1982,1981,1980,1979,1978,1977,1976,1975,1974,1973,1972,1971
This statistics in other country:
Timeline:
This timeline shows a graph from 1971 to 2016 of Sri Lanka. No data until 1970. Number of actual observations by date: 46.
Source name:
World Development Indicators
Source organization:
World Bank, International Debt Statistics.
Categories, topics:
Economy & Growth, External Debt
Last updated:
apr 23, 2017
Indicators value changes by year
Minimum:
16.107
jan 1, 1994
Maximum:
234.452
jan 1, 1989
At the date of observation
Value
Absolute change
Change from previous value
jan 1, 1971
88.91
+88.91
0.0%
jan 1, 1972
91.559
+2.649
2.98%
jan 1, 1973
82.483
-9.076
-9.91%
jan 1, 1974
63.529
-18.954
-22.98%
jan 1, 1975
88.942
+25.413
40.0%
jan 1, 1976
125.367
+36.425
40.95%
jan 1, 1977
88.849
-36.518
-29.13%
jan 1, 1978
49.9
-38.949
-43.84%
jan 1, 1979
27.019
-22.88
-45.85%
jan 1, 1980
24.768
-2.252
-8.33%
jan 1, 1981
77.775
+53.007
214.02%
jan 1, 1982
57.875
-19.9
-25.59%
jan 1, 1983
72.551
+14.676
25.36%
jan 1, 1984
88.365
+15.814
21.8%
jan 1, 1985
36.73
-51.635
-58.43%
jan 1, 1986
43.723
+6.993
19.04%
jan 1, 1987
48.937
+5.215
11.93%
jan 1, 1988
88.318
+39.381
80.47%
jan 1, 1989
234.452
+146.134
165.46%
jan 1, 1990
148.792
-85.66
-36.54%
jan 1, 1991
90.569
-58.223
-39.13%
jan 1, 1992
56.54
-34.029
-37.57%
jan 1, 1993
25.496
-31.044
-54.91%
jan 1, 1994
16.107
-9.389
-36.82%
jan 1, 1995
26.009
+9.902
61.47%
jan 1, 1996
25.347
-0.661
-2.54%
jan 1, 1997
28.192
+2.845
11.22%
jan 1, 1998
23.067
-5.125
-18.18%
jan 1, 1999
21.03
-2.037
-8.83%
jan 1, 2000
56.21
+35.18
167.28%
jan 1, 2001
60.508
+4.298
7.65%
jan 1, 2002
53.923
-6.584
-10.88%
jan 1, 2003
55.362
+1.439
2.67%
jan 1, 2004
32.479
-22.883
-41.33%
jan 1, 2005
46.76
+14.281
43.97%
jan 1, 2006
28.232
-18.528
-39.62%
jan 1, 2007
24.418
-3.814
-13.51%
jan 1, 2008
38.012
+13.594
55.67%
jan 1, 2009
104.145
+66.133
173.98%
jan 1, 2010
66.376
-37.769
-36.27%
jan 1, 2011
33.572
-32.804
-49.42%
jan 1, 2012
53.059
+19.488
58.05%
jan 1, 2013
90.326
+37.267
70.24%
jan 1, 2014
90.334
+0.008
0.01%
jan 1, 2015
89.214
-1.12
-1.24%
jan 1, 2016
103.912
+14.698
16.48%
Ranking of countries by current statistics by years


Comments: