29
/
en
AIzaSyAYiBZKx7MnpbEhh9jyipgxe19OcubqV5w
April 1, 2024
40348
IDA total
IDA
false
2
1
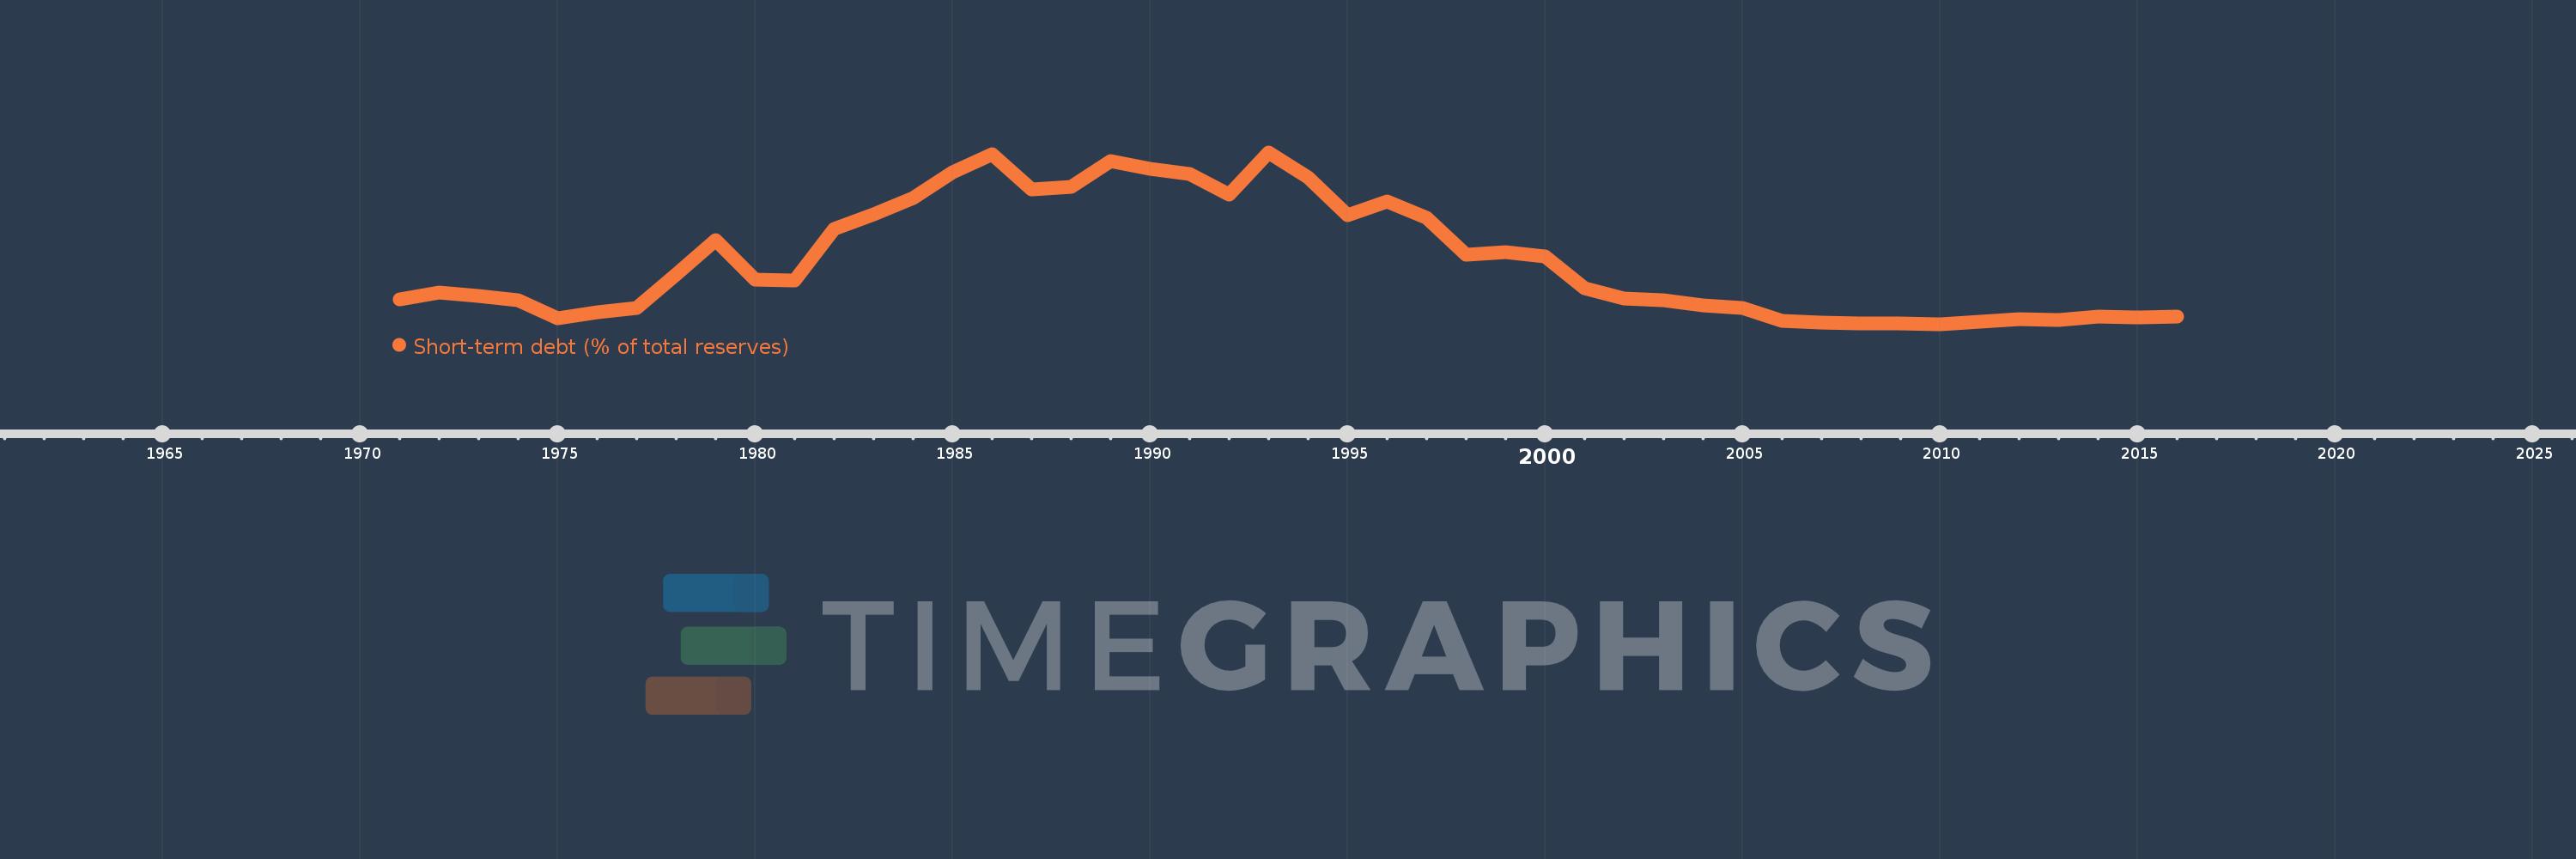
Short-term debt (% of total reserves)
2016,2015,2014,2013,2012,2011,2010,2009,2008,2007,2006,2005,2004,2003,2002,2001,2000,1999,1998,1997,1996,1995,1994,1993,1992,1991,1990,1989,1988,1987,1986,1985,1984,1983,1982,1981,1980,1979,1978,1977,1976,1975,1974,1973,1972,1971
This statistics in other country:
Timeline:
This timeline shows a graph from 1971 to 2016 of IDA total. No data until 1970. Number of actual observations by date: 46.
Source name:
World Development Indicators
Source organization:
World Bank, International Debt Statistics.
Categories, topics:
Economy & Growth, External Debt
Last updated:
apr 23, 2017
Indicators value changes by year
Minimum:
18.237
jan 1, 2010
Maximum:
224.264
jan 1, 1993
At the date of observation
Value
Absolute change
Change from previous value
jan 1, 1971
48.114
+48.114
0.0%
jan 1, 1972
56.064
+7.951
16.53%
jan 1, 1973
51.666
-4.398
-7.85%
jan 1, 1974
47.036
-4.63
-8.96%
jan 1, 1975
25.636
-21.4
-45.5%
jan 1, 1976
32.29
+6.654
25.96%
jan 1, 1977
37.827
+5.537
17.15%
jan 1, 1978
77.435
+39.608
104.71%
jan 1, 1979
119.438
+42.003
54.24%
jan 1, 1980
71.862
-47.576
-39.83%
jan 1, 1981
71.185
-0.677
-0.94%
jan 1, 1982
132.657
+61.472
86.35%
jan 1, 1983
149.953
+17.296
13.04%
jan 1, 1984
169.76
+19.807
13.21%
jan 1, 1985
200.344
+30.584
18.02%
jan 1, 1986
222.152
+21.808
10.89%
jan 1, 1987
180.214
-41.938
-18.88%
jan 1, 1988
183.253
+3.04
1.69%
jan 1, 1989
213.537
+30.284
16.53%
jan 1, 1990
205.003
-8.534
-4.0%
jan 1, 1991
198.026
-6.977
-3.4%
jan 1, 1992
173.315
-24.711
-12.48%
jan 1, 1993
224.264
+50.949
29.4%
jan 1, 1994
194.679
-29.586
-13.19%
jan 1, 1995
148.526
-46.153
-23.71%
jan 1, 1996
165.055
+16.529
11.13%
jan 1, 1997
145.73
-19.325
-11.71%
jan 1, 1998
101.927
-43.803
-30.06%
jan 1, 1999
104.364
+2.437
2.39%
jan 1, 2000
99.85
-4.514
-4.33%
jan 1, 2001
61.019
-38.831
-38.89%
jan 1, 2002
49.034
-11.985
-19.64%
jan 1, 2003
47.379
-1.655
-3.38%
jan 1, 2004
40.517
-6.862
-14.48%
jan 1, 2005
37.253
-3.264
-8.06%
jan 1, 2006
22.586
-14.667
-39.37%
jan 1, 2007
20.613
-1.973
-8.74%
jan 1, 2008
19.579
-1.034
-5.02%
jan 1, 2009
19.451
-0.128
-0.65%
jan 1, 2010
18.237
-1.214
-6.24%
jan 1, 2011
20.932
+2.695
14.78%
jan 1, 2012
23.825
+2.893
13.82%
jan 1, 2013
23.409
-0.416
-1.75%
jan 1, 2014
27.39
+3.981
17.01%
jan 1, 2015
26.53
-0.86
-3.14%
jan 1, 2016
27.115
+0.585
2.2%
Ranking of countries by current statistics by years


Comments: