29
/
en
AIzaSyAYiBZKx7MnpbEhh9jyipgxe19OcubqV5w
April 1, 2024
149770
Haiti
HTI
true
2
1
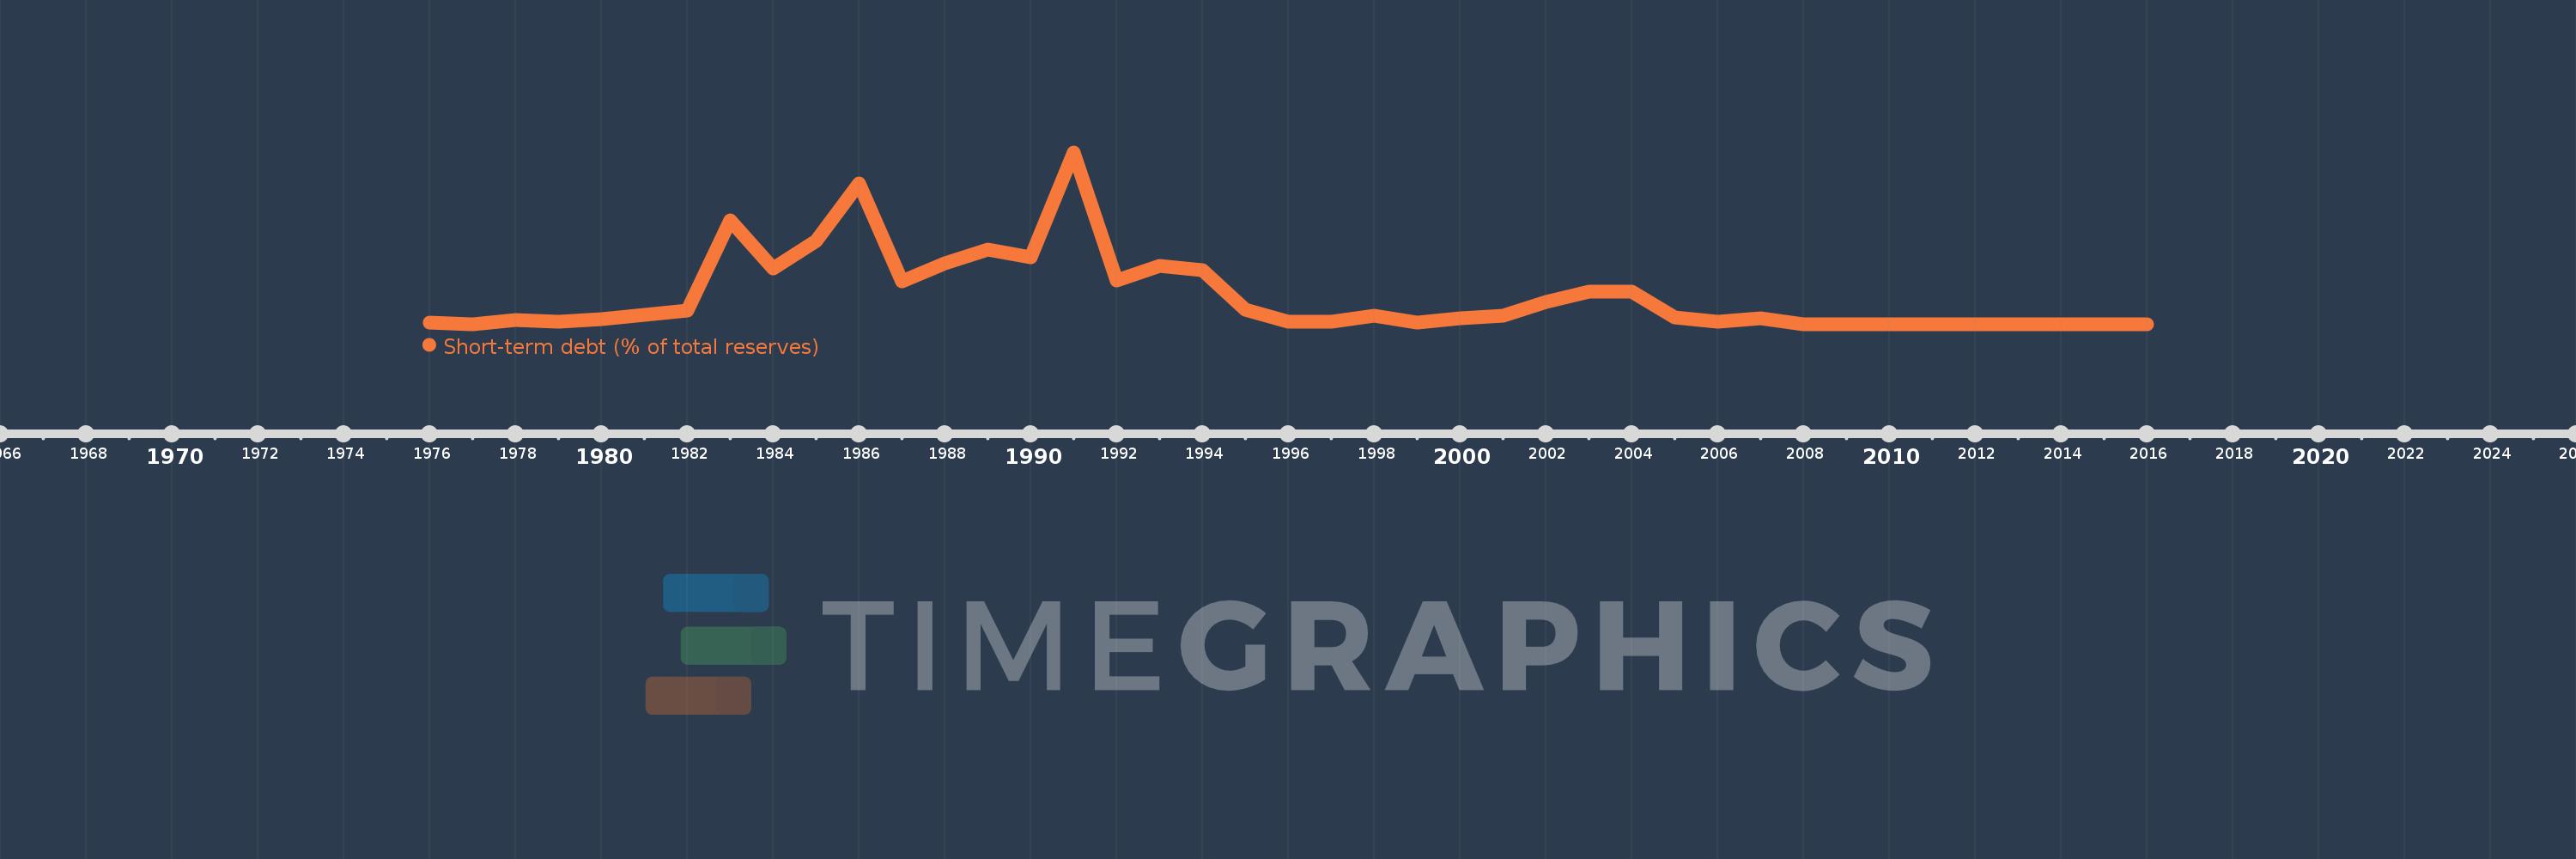
Short-term debt (% of total reserves)
2016,2015,2014,2013,2012,2011,2010,2009,2008,2007,2006,2005,2004,2003,2002,2001,2000,1999,1998,1997,1996,1995,1994,1993,1992,1991,1990,1989,1988,1987,1986,1985,1984,1983,1982,1981,1980,1979,1978,1977,1976
This statistics in other country:
Timeline:
This timeline shows a graph from 1976 to 2016 of Haiti. No data until 1975. Number of actual observations by date: 41.
Source name:
World Development Indicators
Source organization:
World Bank, International Debt Statistics.
Categories, topics:
Economy & Growth, External Debt
Last updated:
apr 23, 2017
Indicators value changes by year
Maximum:
992.02
jan 1, 1991
At the date of observation
Value
Absolute change
Change from previous value
jan 1, 1976
7.828
+7.828
0.0%
jan 1, 1977
0.0
-7.828
-100.0%
jan 1, 1978
23.009
+23.009
%
jan 1, 1979
14.694
-8.315
-36.14%
jan 1, 1980
29.626
+14.932
101.62%
jan 1, 1981
52.389
+22.763
76.83%
jan 1, 1982
77.59
+25.201
48.1%
jan 1, 1983
599.103
+521.513
672.14%
jan 1, 1984
322.359
-276.744
-46.19%
jan 1, 1985
480.409
+158.051
49.03%
jan 1, 1986
814.694
+334.284
69.58%
jan 1, 1987
246.084
-568.61
-69.79%
jan 1, 1988
353.698
+107.614
43.73%
jan 1, 1989
430.43
+76.732
21.69%
jan 1, 1990
387.947
-42.483
-9.87%
jan 1, 1991
992.02
+604.073
155.71%
jan 1, 1992
253.314
-738.706
-74.46%
jan 1, 1993
338.675
+85.361
33.7%
jan 1, 1994
311.135
-27.539
-8.13%
jan 1, 1995
83.973
-227.163
-73.01%
jan 1, 1996
13.396
-70.577
-84.05%
jan 1, 1997
16.261
+2.866
21.39%
jan 1, 1998
50.376
+34.114
209.79%
jan 1, 1999
11.285
-39.091
-77.6%
jan 1, 2000
36.32
+25.036
221.86%
jan 1, 2001
49.475
+13.155
36.22%
jan 1, 2002
130.59
+81.115
163.95%
jan 1, 2003
187.503
+56.914
43.58%
jan 1, 2004
187.41
-0.093
-0.05%
jan 1, 2005
39.609
-147.801
-78.86%
jan 1, 2006
12.626
-26.983
-68.12%
jan 1, 2007
34.267
+21.641
171.39%
jan 1, 2008
0.0
-34.267
-100.0%
jan 1, 2011
0.004
+0.004
%
jan 1, 2012
0.0
-0.004
-100.0%
jan 1, 2015
0.037
+0.037
%
jan 1, 2016
0.203
+0.167
453.14%
Ranking of countries by current statistics by years


Comments: