29
/
en
AIzaSyAYiBZKx7MnpbEhh9jyipgxe19OcubqV5w
April 1, 2024
274314
Ukraine
UKR
true
2
1
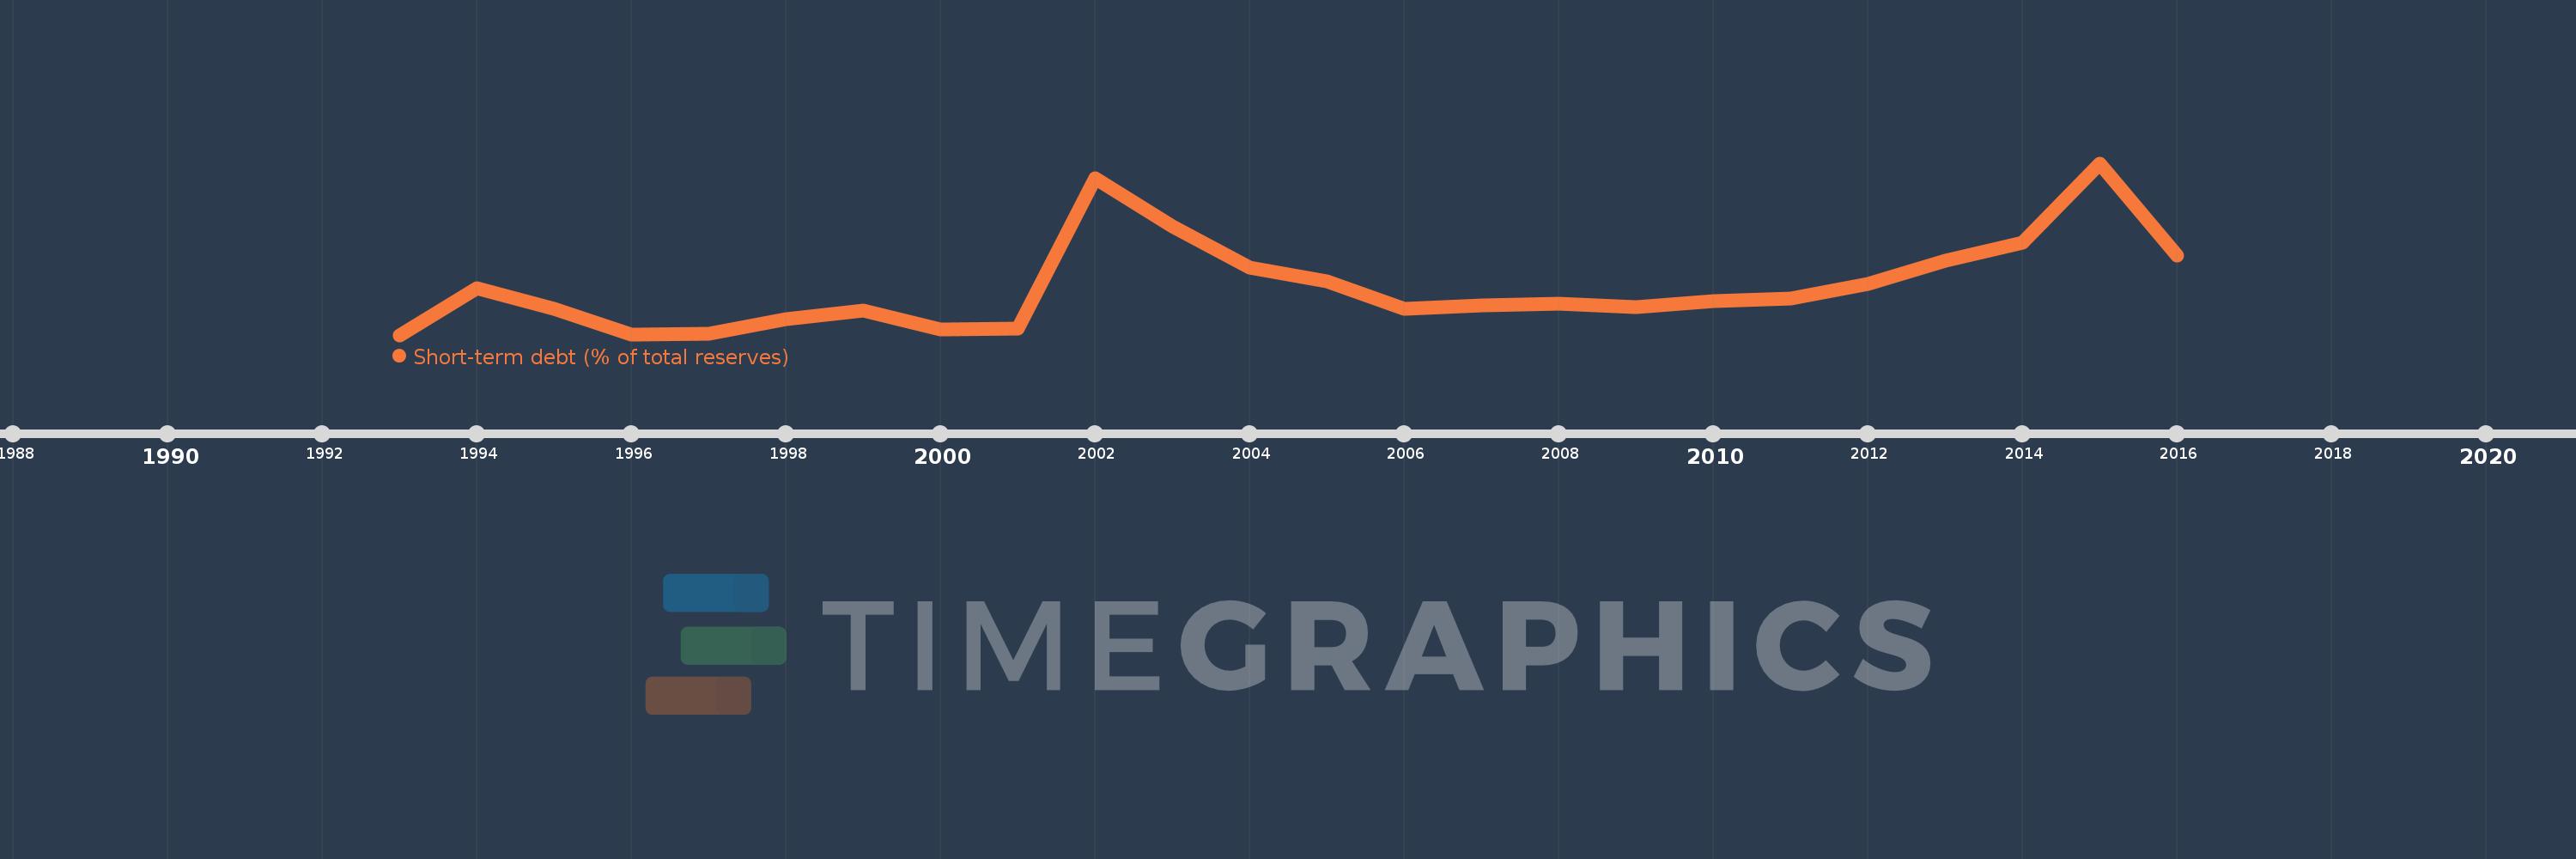
Short-term debt (% of total reserves)
2016,2015,2014,2013,2012,2011,2010,2009,2008,2007,2006,2005,2004,2003,2002,2001,2000,1999,1998,1997,1996,1995,1994,1993
This statistics in other country:
Timeline:
This timeline shows a graph from 1993 to 2016 of Ukraine. No data until 1992. Number of actual observations by date: 24.
Source name:
World Development Indicators
Source organization:
World Bank, International Debt Statistics.
Categories, topics:
Economy & Growth, External Debt
Last updated:
apr 23, 2017
Indicators value changes by year
Minimum:
19.822
jan 1, 1993
Maximum:
300.968
jan 1, 2015
At the date of observation
Value
Absolute change
Change from previous value
jan 1, 1993
19.822
+19.822
0.0%
jan 1, 1994
96.812
+76.99
388.4%
jan 1, 1995
62.788
-34.024
-35.14%
jan 1, 1996
20.899
-41.889
-66.72%
jan 1, 1997
22.51
+1.611
7.71%
jan 1, 1998
46.166
+23.656
105.09%
jan 1, 1999
60.455
+14.289
30.95%
jan 1, 2000
28.84
-31.615
-52.29%
jan 1, 2001
30.269
+1.429
4.95%
jan 1, 2002
277.012
+246.743
815.17%
jan 1, 2003
197.525
-79.488
-28.69%
jan 1, 2004
129.786
-67.739
-34.29%
jan 1, 2005
107.425
-22.361
-17.23%
jan 1, 2006
62.218
-45.206
-42.08%
jan 1, 2007
68.698
+6.48
10.41%
jan 1, 2008
70.539
+1.841
2.68%
jan 1, 2009
65.42
-5.119
-7.26%
jan 1, 2010
74.991
+9.571
14.63%
jan 1, 2011
78.863
+3.871
5.16%
jan 1, 2012
102.95
+24.088
30.54%
jan 1, 2013
141.534
+38.584
37.48%
jan 1, 2014
170.588
+29.054
20.53%
jan 1, 2015
300.968
+130.38
76.43%
jan 1, 2016
149.9
-151.067
-50.19%
Ranking of countries by current statistics by years


Comments: