29
/
en
AIzaSyAYiBZKx7MnpbEhh9jyipgxe19OcubqV5w
April 1, 2024
207456
Nepal
NPL
true
2
1
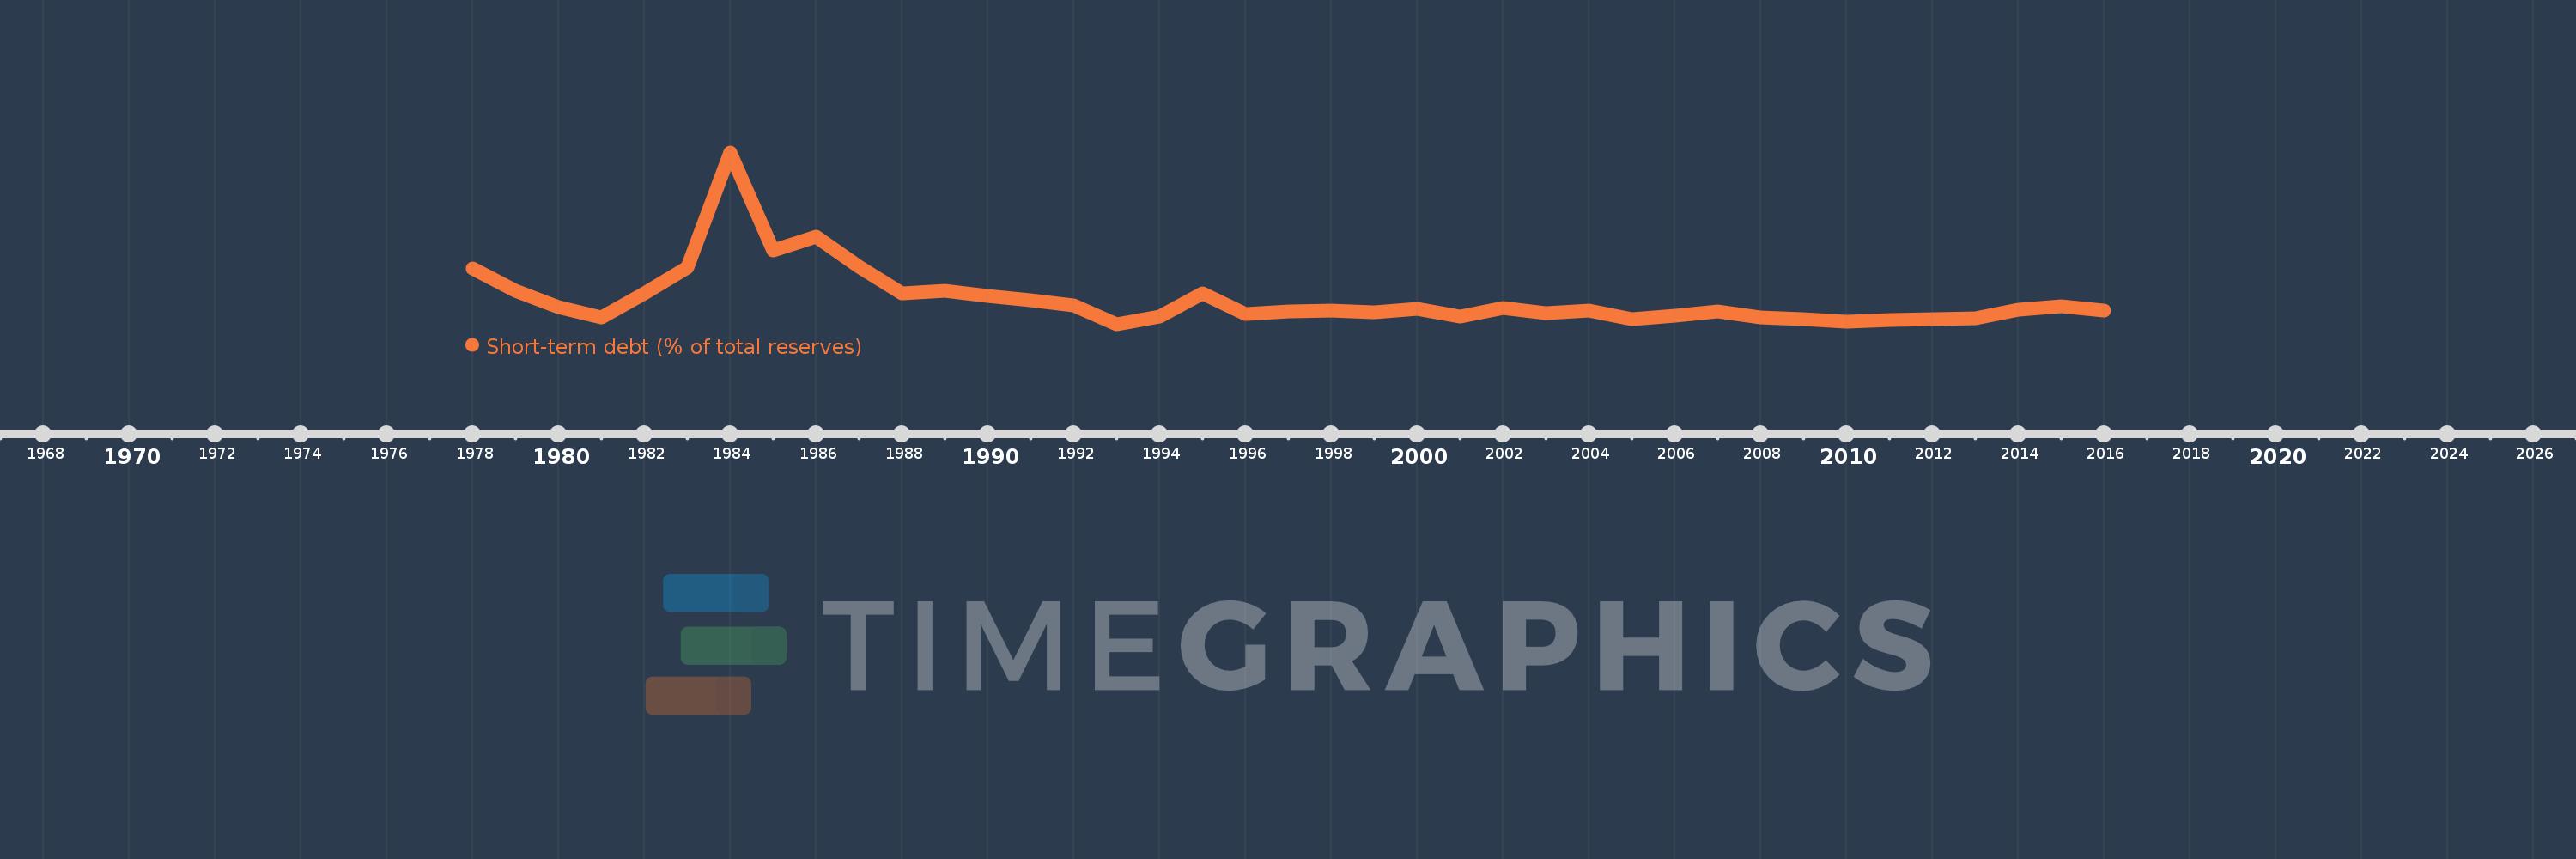
Short-term debt (% of total reserves)
2016,2015,2014,2013,2012,2011,2010,2009,2008,2007,2006,2005,2004,2003,2002,2001,2000,1999,1998,1997,1996,1995,1994,1993,1992,1991,1990,1989,1988,1987,1986,1985,1984,1983,1982,1981,1980,1979,1978
This statistics in other country:
Timeline:
This timeline shows a graph from 1978 to 2016 of Nepal. No data until 1977. Number of actual observations by date: 39.
Source name:
World Development Indicators
Source organization:
World Bank, International Debt Statistics.
Categories, topics:
Economy & Growth, External Debt
Last updated:
apr 23, 2017
Indicators value changes by year
Maximum:
41.871
jan 1, 1984
At the date of observation
Value
Absolute change
Change from previous value
jan 1, 1978
14.252
+14.252
0.0%
jan 1, 1979
8.985
-5.267
-36.96%
jan 1, 1980
5.101
-3.884
-43.23%
jan 1, 1981
2.574
-2.527
-49.53%
jan 1, 1982
8.395
+5.821
226.14%
jan 1, 1983
14.532
+6.137
73.1%
jan 1, 1984
41.871
+27.339
188.13%
jan 1, 1985
18.663
-23.208
-55.43%
jan 1, 1986
21.808
+3.145
16.85%
jan 1, 1987
14.67
-7.138
-32.73%
jan 1, 1988
8.344
-6.326
-43.12%
jan 1, 1989
9.042
+0.698
8.37%
jan 1, 1990
7.766
-1.276
-14.11%
jan 1, 1991
6.848
-0.917
-11.81%
jan 1, 1992
5.625
-1.224
-17.87%
jan 1, 1993
1.061
-4.564
-81.14%
jan 1, 1994
2.959
+1.897
178.82%
jan 1, 1995
8.33
+5.372
181.56%
jan 1, 1996
3.542
-4.789
-57.49%
jan 1, 1997
4.101
+0.56
15.81%
jan 1, 1998
4.234
+0.133
3.24%
jan 1, 1999
3.863
-0.371
-8.77%
jan 1, 2000
4.783
+0.92
23.81%
jan 1, 2001
2.937
-1.846
-38.59%
jan 1, 2002
5.0
+2.063
70.24%
jan 1, 2003
3.738
-1.262
-25.24%
jan 1, 2004
4.276
+0.538
14.38%
jan 1, 2005
2.354
-1.922
-44.94%
jan 1, 2006
3.003
+0.648
27.54%
jan 1, 2007
4.185
+1.182
39.37%
jan 1, 2008
2.731
-1.454
-34.75%
jan 1, 2009
2.319
-0.412
-15.08%
jan 1, 2010
1.561
-0.758
-32.71%
jan 1, 2011
2.031
+0.471
30.18%
jan 1, 2012
2.269
+0.237
11.68%
jan 1, 2013
2.558
+0.289
12.74%
jan 1, 2014
4.593
+2.035
79.57%
jan 1, 2015
5.355
+0.762
16.59%
jan 1, 2016
4.29
-1.065
-19.89%
Ranking of countries by current statistics by years


Comments: