29
/
en
AIzaSyAYiBZKx7MnpbEhh9jyipgxe19OcubqV5w
April 1, 2024
222935
Peru
PER
true
2
1
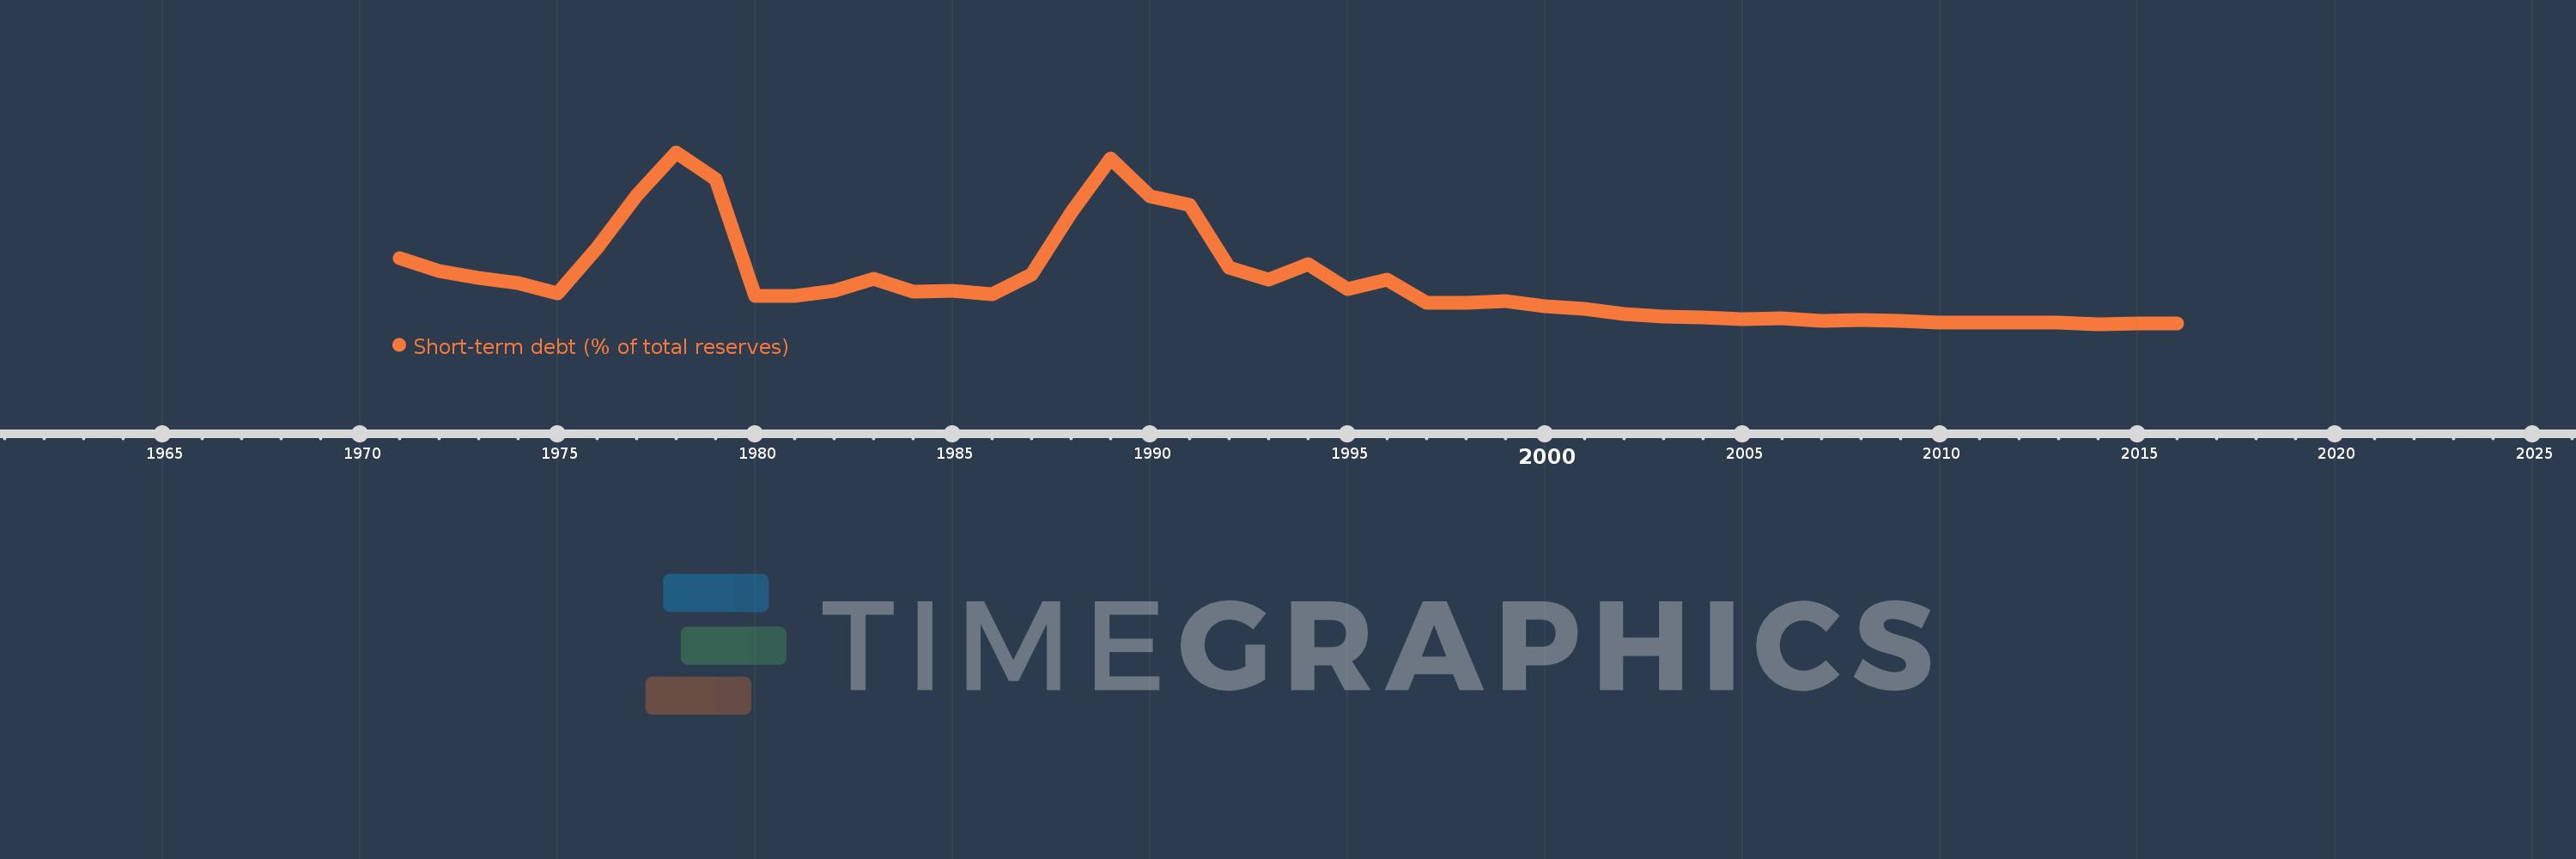
Short-term debt (% of total reserves)
2016,2015,2014,2013,2012,2011,2010,2009,2008,2007,2006,2005,2004,2003,2002,2001,2000,1999,1998,1997,1996,1995,1994,1993,1992,1991,1990,1989,1988,1987,1986,1985,1984,1983,1982,1981,1980,1979,1978,1977,1976,1975,1974,1973,1972,1971
This statistics in other country:
Timeline:
This timeline shows a graph from 1971 to 2016 of Peru. No data until 1970. Number of actual observations by date: 46.
Source name:
World Development Indicators
Source organization:
World Bank, International Debt Statistics.
Categories, topics:
Economy & Growth, External Debt
Last updated:
apr 23, 2017
Indicators value changes by year
Maximum:
402.126
jan 1, 1978
At the date of observation
Value
Absolute change
Change from previous value
jan 1, 1971
161.225
+161.225
0.0%
jan 1, 1972
130.862
-30.362
-18.83%
jan 1, 1973
114.77
-16.092
-12.3%
jan 1, 1974
103.655
-11.114
-9.68%
jan 1, 1975
80.196
-23.46
-22.63%
jan 1, 1976
183.869
+103.673
129.27%
jan 1, 1977
303.651
+119.783
65.15%
jan 1, 1978
402.126
+98.474
32.43%
jan 1, 1979
340.248
-61.878
-15.39%
jan 1, 1980
74.471
-265.777
-78.11%
jan 1, 1981
74.324
-0.147
-0.2%
jan 1, 1982
86.373
+12.05
16.21%
jan 1, 1983
114.464
+28.091
32.52%
jan 1, 1984
85.075
-29.389
-25.68%
jan 1, 1985
86.716
+1.641
1.93%
jan 1, 1986
78.963
-7.752
-8.94%
jan 1, 1987
124.162
+45.199
57.24%
jan 1, 1988
263.91
+139.748
112.55%
jan 1, 1989
388.108
+124.198
47.06%
jan 1, 1990
301.265
-86.843
-22.38%
jan 1, 1991
282.3
-18.965
-6.3%
jan 1, 1992
139.848
-142.452
-50.46%
jan 1, 1993
112.176
-27.672
-19.79%
jan 1, 1994
145.989
+33.812
30.14%
jan 1, 1995
90.479
-55.51
-38.02%
jan 1, 1996
111.624
+21.145
23.37%
jan 1, 1997
58.576
-53.048
-47.52%
jan 1, 1998
57.76
-0.816
-1.39%
jan 1, 1999
63.293
+5.533
9.58%
jan 1, 2000
50.517
-12.775
-20.18%
jan 1, 2001
45.278
-5.24
-10.37%
jan 1, 2002
33.561
-11.716
-25.88%
jan 1, 2003
26.633
-6.928
-20.64%
jan 1, 2004
24.653
-1.98
-7.43%
jan 1, 2005
21.888
-2.764
-11.21%
jan 1, 2006
22.664
+0.775
3.54%
jan 1, 2007
17.269
-5.395
-23.8%
jan 1, 2008
19.197
+1.928
11.16%
jan 1, 2009
17.35
-1.847
-9.62%
jan 1, 2010
14.4
-2.95
-17.0%
jan 1, 2011
14.459
+0.059
0.41%
jan 1, 2012
12.931
-1.528
-10.56%
jan 1, 2013
13.299
+0.368
2.84%
jan 1, 2014
9.807
-3.492
-26.25%
jan 1, 2015
11.159
+1.352
13.79%
jan 1, 2016
11.486
+0.326
2.93%
Ranking of countries by current statistics by years


Comments: