29
/
en
AIzaSyAYiBZKx7MnpbEhh9jyipgxe19OcubqV5w
April 1, 2024
41928
Latin America & Caribbean
LCN
false
2
1
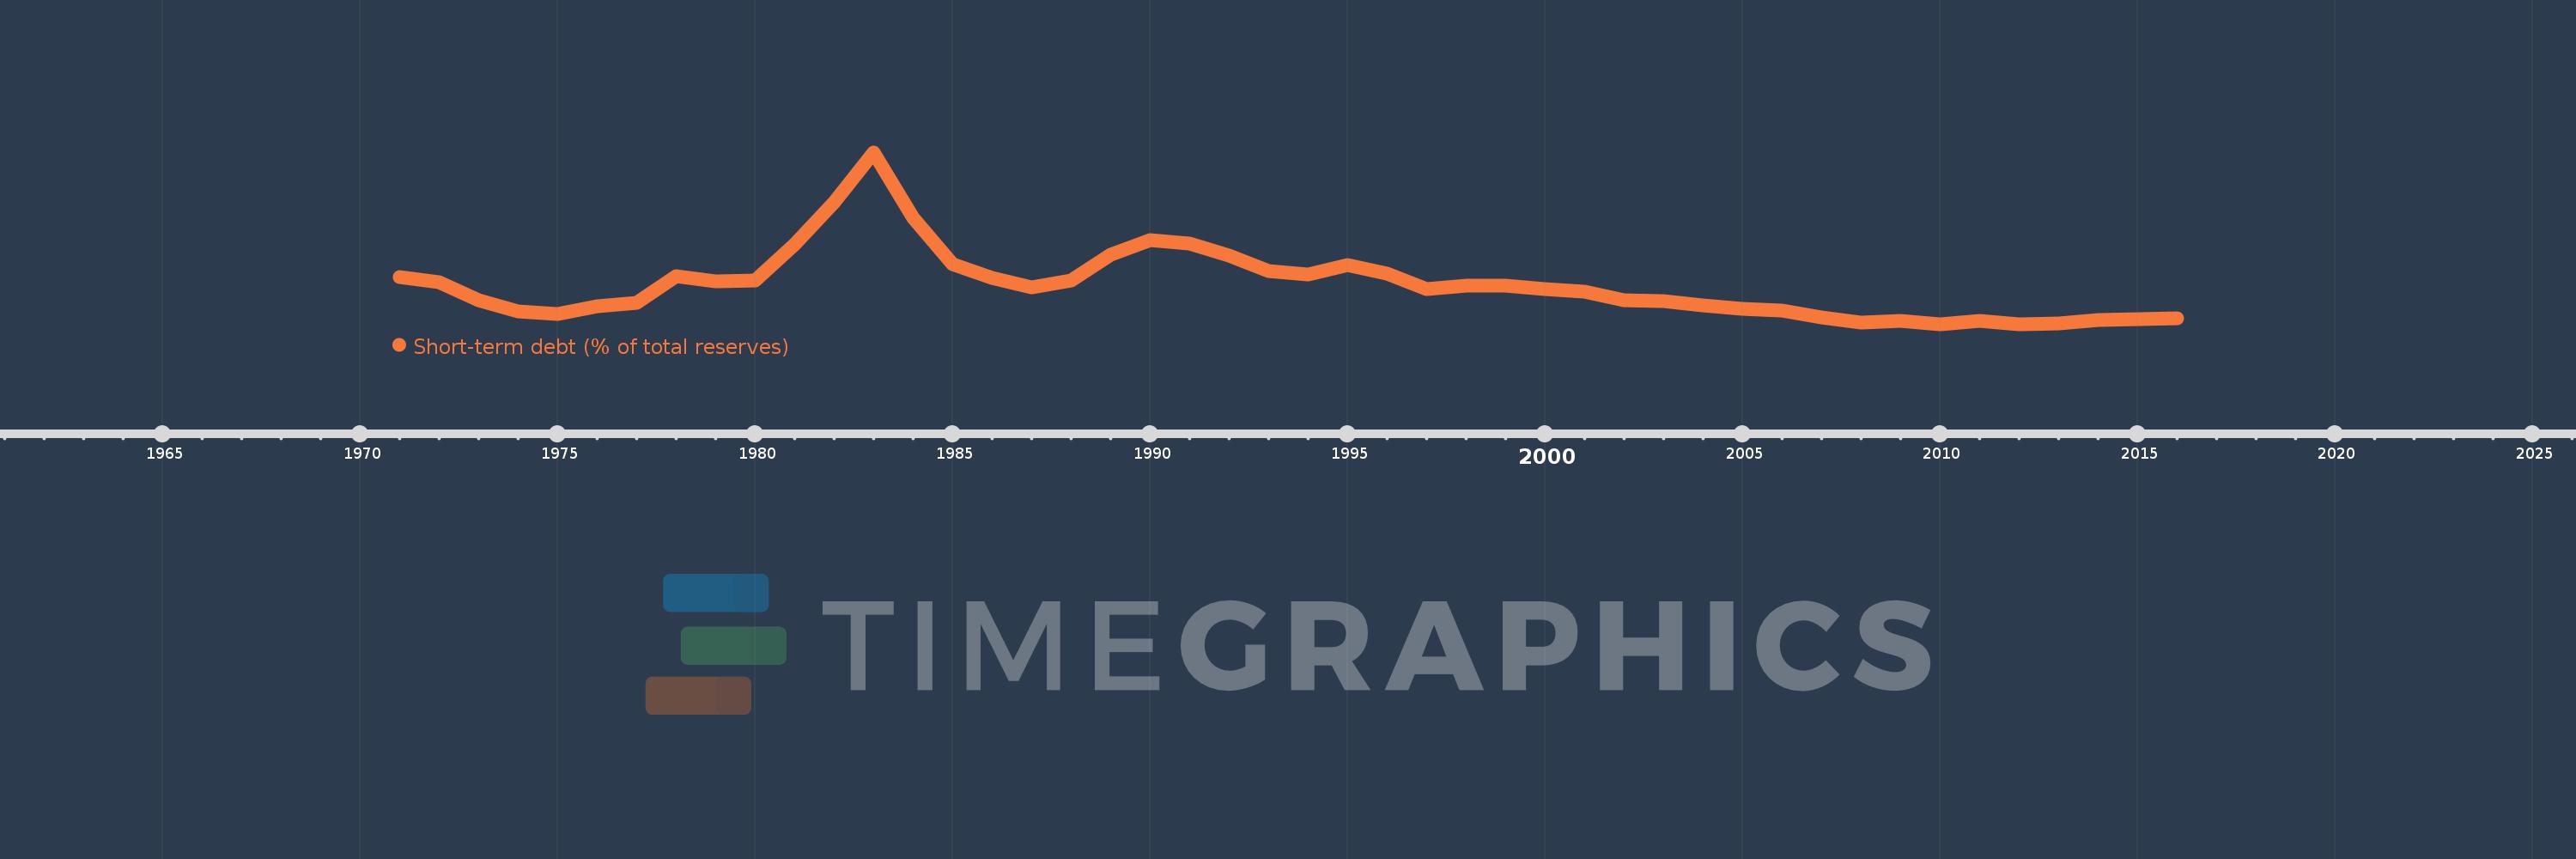
Short-term debt (% of total reserves)
2016,2015,2014,2013,2012,2011,2010,2009,2008,2007,2006,2005,2004,2003,2002,2001,2000,1999,1998,1997,1996,1995,1994,1993,1992,1991,1990,1989,1988,1987,1986,1985,1984,1983,1982,1981,1980,1979,1978,1977,1976,1975,1974,1973,1972,1971
This statistics in other country:
Timeline:
This timeline shows a graph from 1971 to 2016 of Latin America & Caribbean . No data until 1970. Number of actual observations by date: 46.
Source name:
World Development Indicators
Source organization:
World Bank, International Debt Statistics.
Categories, topics:
Economy & Growth, External Debt
Last updated:
apr 23, 2017
Indicators value changes by year
Minimum:
29.099
jan 1, 2010
Maximum:
260.569
jan 1, 1983
At the date of observation
Value
Absolute change
Change from previous value
jan 1, 1971
92.658
+92.658
0.0%
jan 1, 1972
85.551
-7.107
-7.67%
jan 1, 1973
61.435
-24.117
-28.19%
jan 1, 1974
46.555
-14.88
-24.22%
jan 1, 1975
43.332
-3.223
-6.92%
jan 1, 1976
53.197
+9.864
22.76%
jan 1, 1977
57.691
+4.494
8.45%
jan 1, 1978
93.501
+35.81
62.07%
jan 1, 1979
87.161
-6.34
-6.78%
jan 1, 1980
87.749
+0.588
0.68%
jan 1, 1981
137.061
+49.311
56.2%
jan 1, 1982
193.215
+56.154
40.97%
jan 1, 1983
260.569
+67.354
34.86%
jan 1, 1984
172.628
-87.941
-33.75%
jan 1, 1985
110.183
-62.445
-36.17%
jan 1, 1986
91.381
-18.803
-17.07%
jan 1, 1987
79.318
-12.063
-13.2%
jan 1, 1988
87.58
+8.262
10.42%
jan 1, 1989
122.34
+34.76
39.69%
jan 1, 1990
142.682
+20.342
16.63%
jan 1, 1991
138.044
-4.638
-3.25%
jan 1, 1992
121.278
-16.766
-12.15%
jan 1, 1993
100.705
-20.573
-16.96%
jan 1, 1994
96.615
-4.09
-4.06%
jan 1, 1995
108.912
+12.297
12.73%
jan 1, 1996
96.915
-11.997
-11.02%
jan 1, 1997
76.707
-20.208
-20.85%
jan 1, 1998
80.803
+4.096
5.34%
jan 1, 1999
80.611
-0.192
-0.24%
jan 1, 2000
76.963
-3.647
-4.52%
jan 1, 2001
72.829
-4.134
-5.37%
jan 1, 2002
61.56
-11.269
-15.47%
jan 1, 2003
59.682
-1.877
-3.05%
jan 1, 2004
53.916
-5.766
-9.66%
jan 1, 2005
49.695
-4.222
-7.83%
jan 1, 2006
47.773
-1.922
-3.87%
jan 1, 2007
37.981
-9.792
-20.5%
jan 1, 2008
31.178
-6.803
-17.91%
jan 1, 2009
33.448
+2.27
7.28%
jan 1, 2010
29.099
-4.35
-13.0%
jan 1, 2011
33.392
+4.293
14.75%
jan 1, 2012
29.257
-4.134
-12.38%
jan 1, 2013
29.667
+0.409
1.4%
jan 1, 2014
34.507
+4.84
16.32%
jan 1, 2015
36.102
+1.594
4.62%
jan 1, 2016
37.105
+1.004
2.78%
Ranking of countries by current statistics by years


Comments: