29
/
en
AIzaSyAYiBZKx7MnpbEhh9jyipgxe19OcubqV5w
April 1, 2024
198292
Moldova
MDA
true
2
1
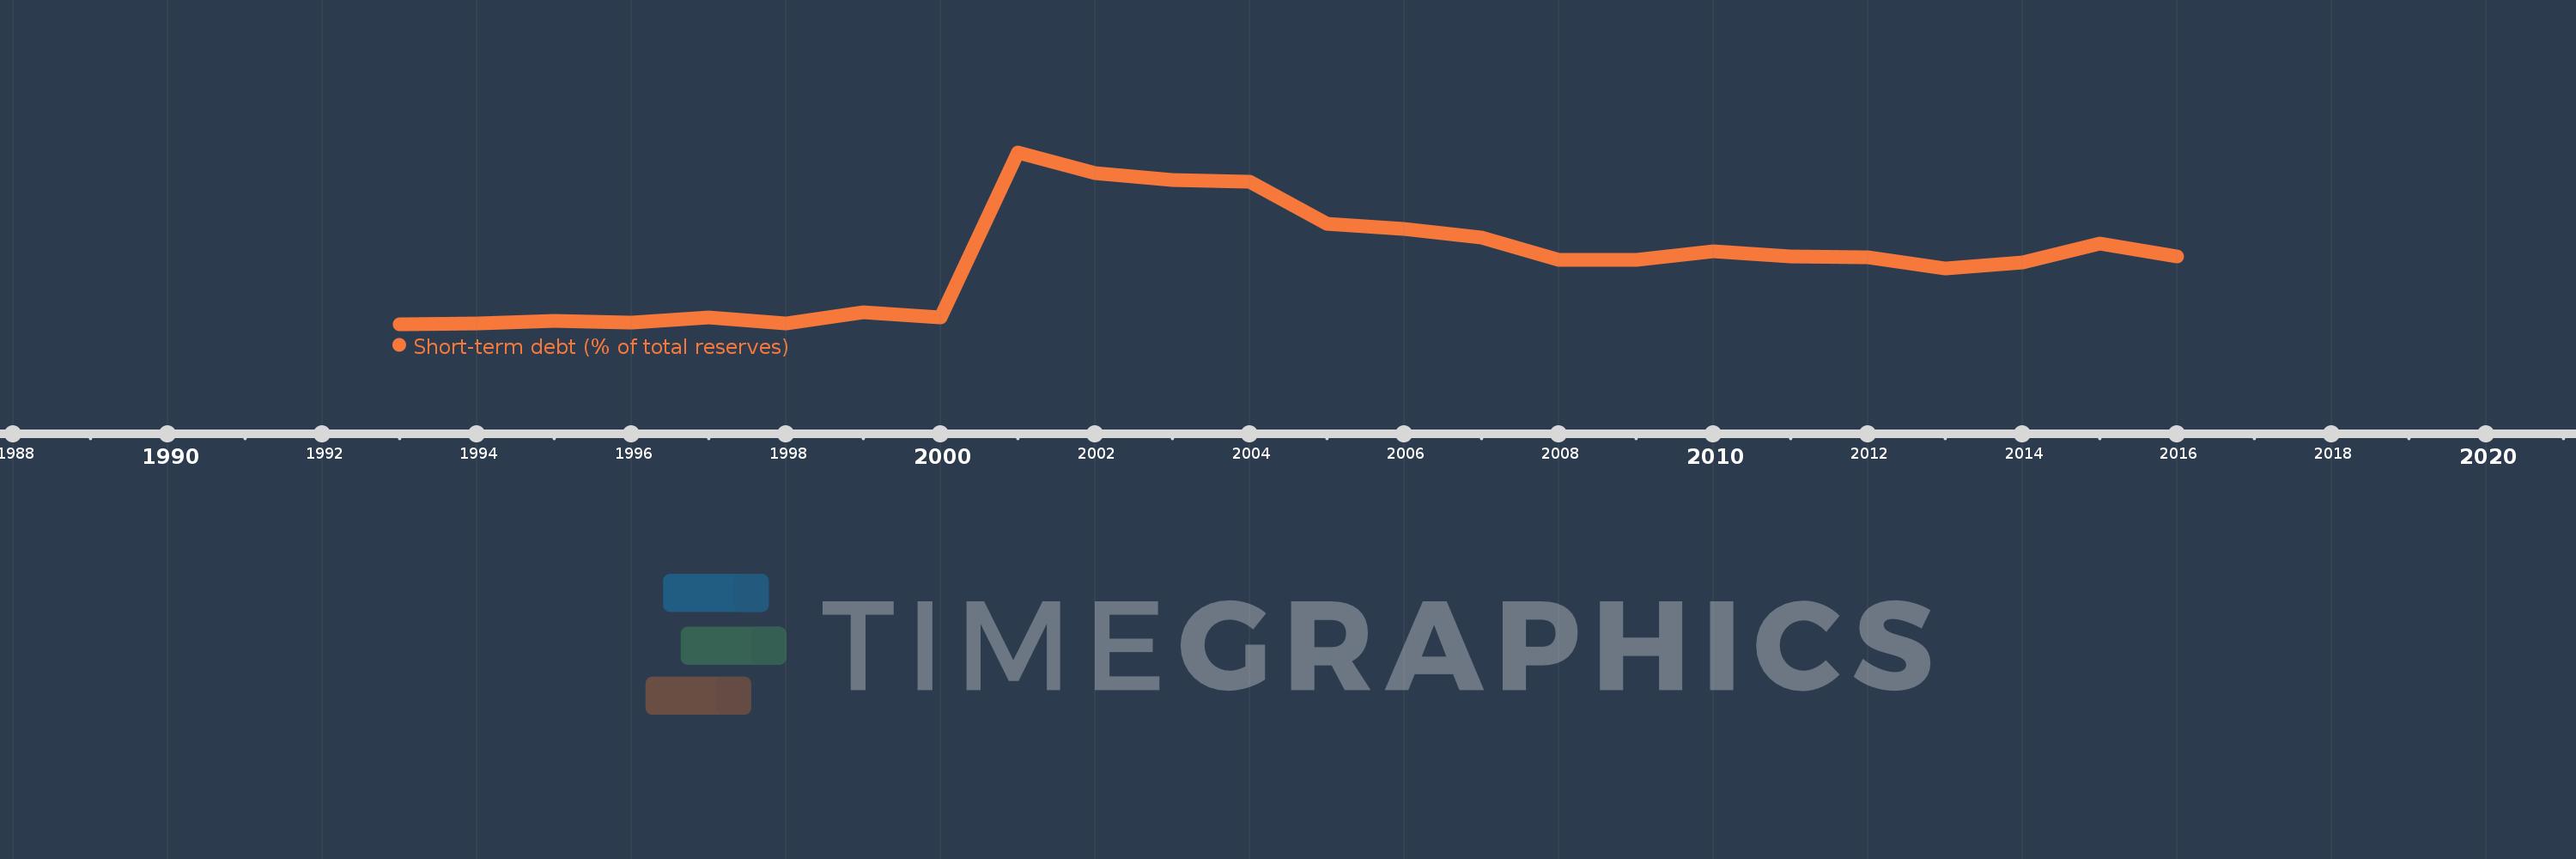
Short-term debt (% of total reserves)
2016,2015,2014,2013,2012,2011,2010,2009,2008,2007,2006,2005,2004,2003,2002,2001,2000,1999,1998,1997,1996,1995,1994,1993
This statistics in other country:
Timeline:
This timeline shows a graph from 1993 to 2016 of Moldova. No data until 1992. Number of actual observations by date: 24.
Source name:
World Development Indicators
Source organization:
World Bank, International Debt Statistics.
Categories, topics:
Economy & Growth, External Debt
Last updated:
apr 23, 2017
Indicators value changes by year
Maximum:
216.131
jan 1, 2001
At the date of observation
Value
Absolute change
Change from previous value
jan 1, 1994
1.137
+1.137
%
jan 1, 1995
4.475
+3.338
293.53%
jan 1, 1996
2.32
-2.155
-48.15%
jan 1, 1997
8.588
+6.268
270.13%
jan 1, 1998
1.095
-7.493
-87.25%
jan 1, 1999
14.674
+13.579
1.24K%
jan 1, 2000
8.641
-6.033
-41.11%
jan 1, 2001
216.131
+207.49
2.4K%
jan 1, 2002
190.58
-25.552
-11.82%
jan 1, 2003
181.732
-8.848
-4.64%
jan 1, 2004
178.926
-2.806
-1.54%
jan 1, 2005
125.927
-52.999
-29.62%
jan 1, 2006
120.107
-5.819
-4.62%
jan 1, 2007
108.596
-11.512
-9.58%
jan 1, 2008
80.901
-27.695
-25.5%
jan 1, 2009
81.196
+0.295
0.36%
jan 1, 2010
92.253
+11.057
13.62%
jan 1, 2011
85.629
-6.624
-7.18%
jan 1, 2012
84.231
-1.398
-1.63%
jan 1, 2013
70.068
-14.163
-16.81%
jan 1, 2014
77.435
+7.367
10.51%
jan 1, 2015
101.681
+24.246
31.31%
jan 1, 2016
85.616
-16.065
-15.8%
Ranking of countries by current statistics by years


Comments: